
Organic material containing aromatic and amide groups, with cellulose/carbohydrate and carbonate features
Peak assignment, library matching and the evidence behind the conclusion.
Organic material containing aromatic and amide groups, with cellulose/carbohydrate and carbonate features
Sample & Measurement Parameters
Interpretation summary
29%The infrared spectrum indicates a mixed organic–inorganic composition. Bands characteristic of aromatic C–N, cellulose CH₂ asymmetric stretching, carbohydrate groups, aliphatic CH₂ deformation, and carbonate confirm the presence of both organic (aromatic/amide, polysaccharide-like) and inorganic (carbonate) phases. The reference library comparison points toward aromatic/amide chemistry, but the sample likely comprises a complex blend rather than a single pure compound FTIR In-Depth Interpretation was not selected for this task, so this section shows the library-search result only and no deep AI interpretation was run.
Detailed interpretation
- Top library match: Acetonitrile #13229
- One source links the 1451 cm⁻¹ band to metal–oxygen vibrations [1]; however, such a high wavenumber is atypical for metal–oxide stretches, and the CH₂ deformation interpretation is more chemically plausible and consistent with the sample’s overall organic character.
- The exact identity of the organic component(s) remains undetermined; the aromatic and amide signals could originate from a synthetic polymer, a protein, or a natural aromatic matrix, but characteristic amide I/II bands above 1500 cm⁻¹ are absent from the available spectral window.
- The sample may be a composite of cellulose, an aromatic/amide‐containing substance, and a carbonate filler or mineral residue.
Retrieved reference candidates
Library Search Results — Top 15 Candidates
| Rank | Match % | Compound | SMILES | Spectrum No. | Action |
|---|---|---|---|---|---|
| Loading library candidates... | |||||
Peak Analysis
★ = Literature-supported assignmentAppendix — Raw Spectrum

Comments and follow-up evidence
Use this area to continue the interpretation, ask questions, or add extra verification evidence.
The above shows the FTIR analysis results of a Pdf file uploaded by a user from Hungary. The original image and extracted CSV file are displayed below.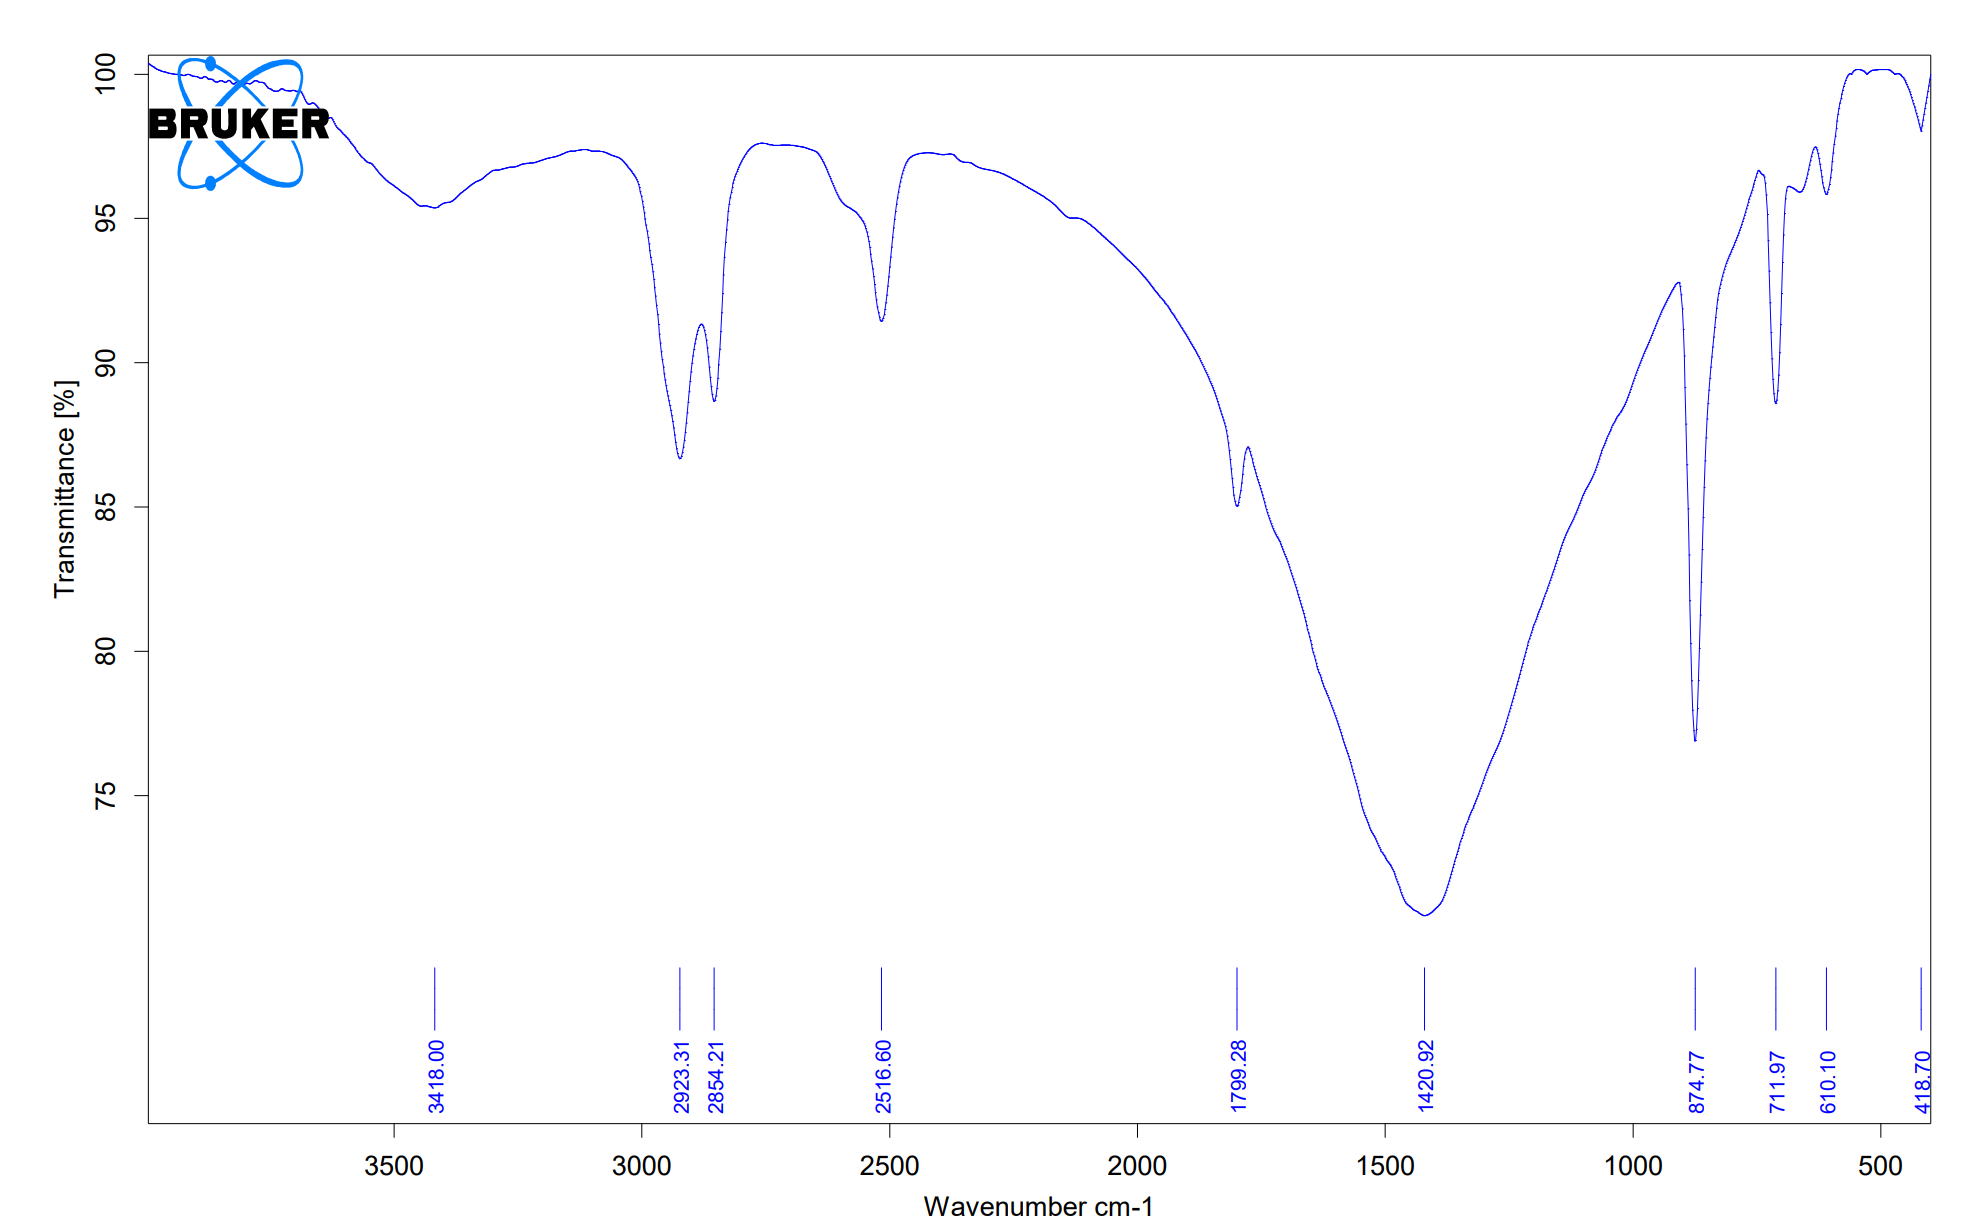 tem.csv
en&2