FTIR spectrum search & scientific interpretation

Better FTIR answers, backed by evidence.

Search reference spectra, analyze unknown samples, inspect three-axis evidence chains, and choose the deployment model that fits your lab — from local offline buyouts to cloud subscriptions and LIMS API integration.

320,000+ reference spectra, continuously updated
Three-Axis scientific interpretation & peak evidence
Local offline buyout · Cloud subscription · REST API / MCP
Strict privacy isolation for paid & enterprise analyses
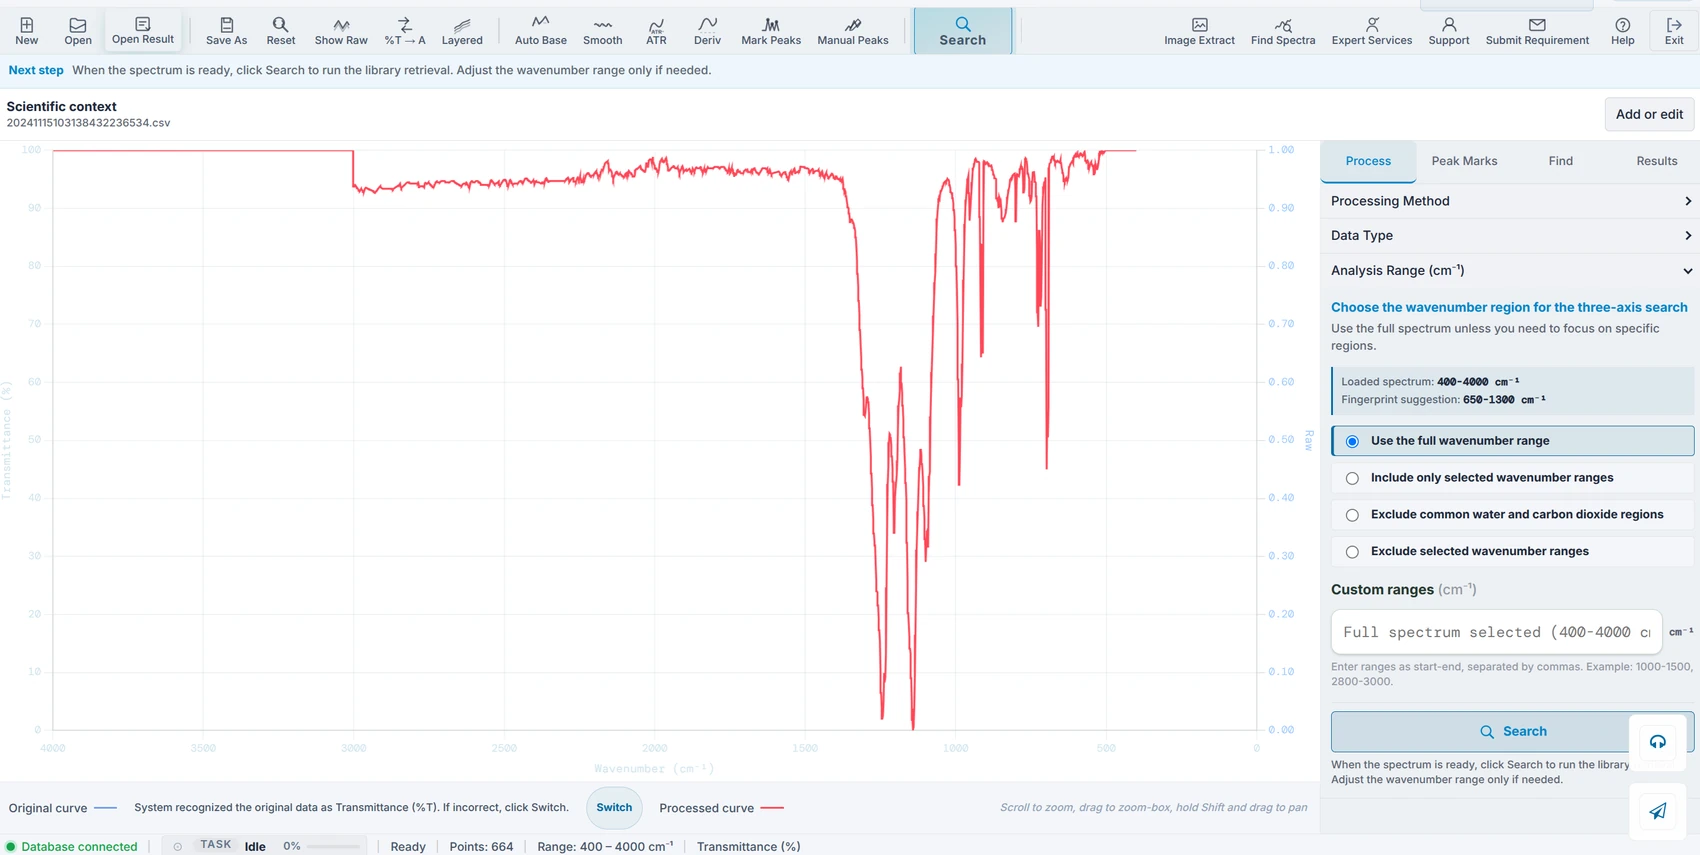
FTIR.fun spectrum search interface with a measured spectrum, ranked reference candidates and supported conclusion
Reference library & deployment

Classic reference library search, delivered in the format your lab needs.

Search across 320,000+ authoritative reference spectra with fast multi-channel retrieval. Whether your lab requires offline local installation, flexible on-demand subscriptions, or seamless LIMS API integration, FTIR.fun fits your operational reality.

Offline & Air-gapped

One-time Buyout & Local Installation

Designed for traditional analytical instrument habits, defense research, university core facilities, and confidential intranets. Runs completely offline on local workstations with a perpetual buyout license, zero cloud data transfer, and zero leakage risk.

  • Perpetual buyout license with offline machine activation
  • Zero internet connection required; data stays 100% on premise
  • Native desktop converter with high-speed local library search
Explore Local editions & formats
Flexible & On-demand

Subscription & Pay-as-you-go

Tailored for low-frequency testing, individual research groups, and lean laboratories. Avoid heavy upfront capital software expenses. Pay only for what you analyze via on-demand credits or flexible monthly and annual subscriptions.

  • No expensive upfront hardware or monolithic software barrier
  • On-demand pay-per-spectrum credit or flexible subscription plans
  • Instant access to continuously updated 320,000+ reference spectra
View pricing & plans
LIMS & Lab Automation

REST API, OpenAPI & MCP Integration

Seamlessly embed spectral library retrieval and peak-evidence interpretation into your existing LIMS, ELN, instrument software, or scientific AI Agents. Standardized endpoints enable automated batch analysis and transparent data pipelines.

  • Direct REST API and Model Context Protocol (MCP) integration
  • Automated unknown spectrum parsing, matching, and logging in LIMS
  • Batch processing throughput for high-volume quality and R&D labs
See laboratory platform integration
Three-Axis scientific interpretation

Results that explain the spectrum, not just rank match scores.

Traditional FTIR software outputs an isolated similarity score, leaving you to guess whether subtle differences invalidate the candidate. FTIR.fun provides an evidence-backed Three-Axis analysis framework that couples candidate retrieval, material family direction, and literature-backed peak attribution into a verifiable scientific conclusion.

The Three-Axis Architecture

How FTIR.fun turns spectral raw curves into audit-grade scientific conclusions

Each axis is independently evaluated and cross-checked against strict numerical gates to prevent false-positive identification.

1
Coverage Gate

Axis 1: Strict 80% Coverage Gate & Candidate Retrieval

A reference spectrum must cover at least 80% of the sample's valid analytical range to enter final ranking. Multi-channel Pearson and Cosine algorithms across original and derivative curves eliminate false high scores from narrow overlapping windows.

80% analytical window gate enforced
2
Direction Gating

Axis 2: Material Direction & Confidence Classification

Scientific conclusions are kept distinct from retrieval similarity. Strict numerical lead-gap gates govern whether evidence confirms a specific entity, identifies a reliable material family, or honestly highlights an unresolved sample.

Entity · Family direction · Uncertain
3
Literature Evidence

Axis 3: Peak Attribution & Traceable Literature Evidence

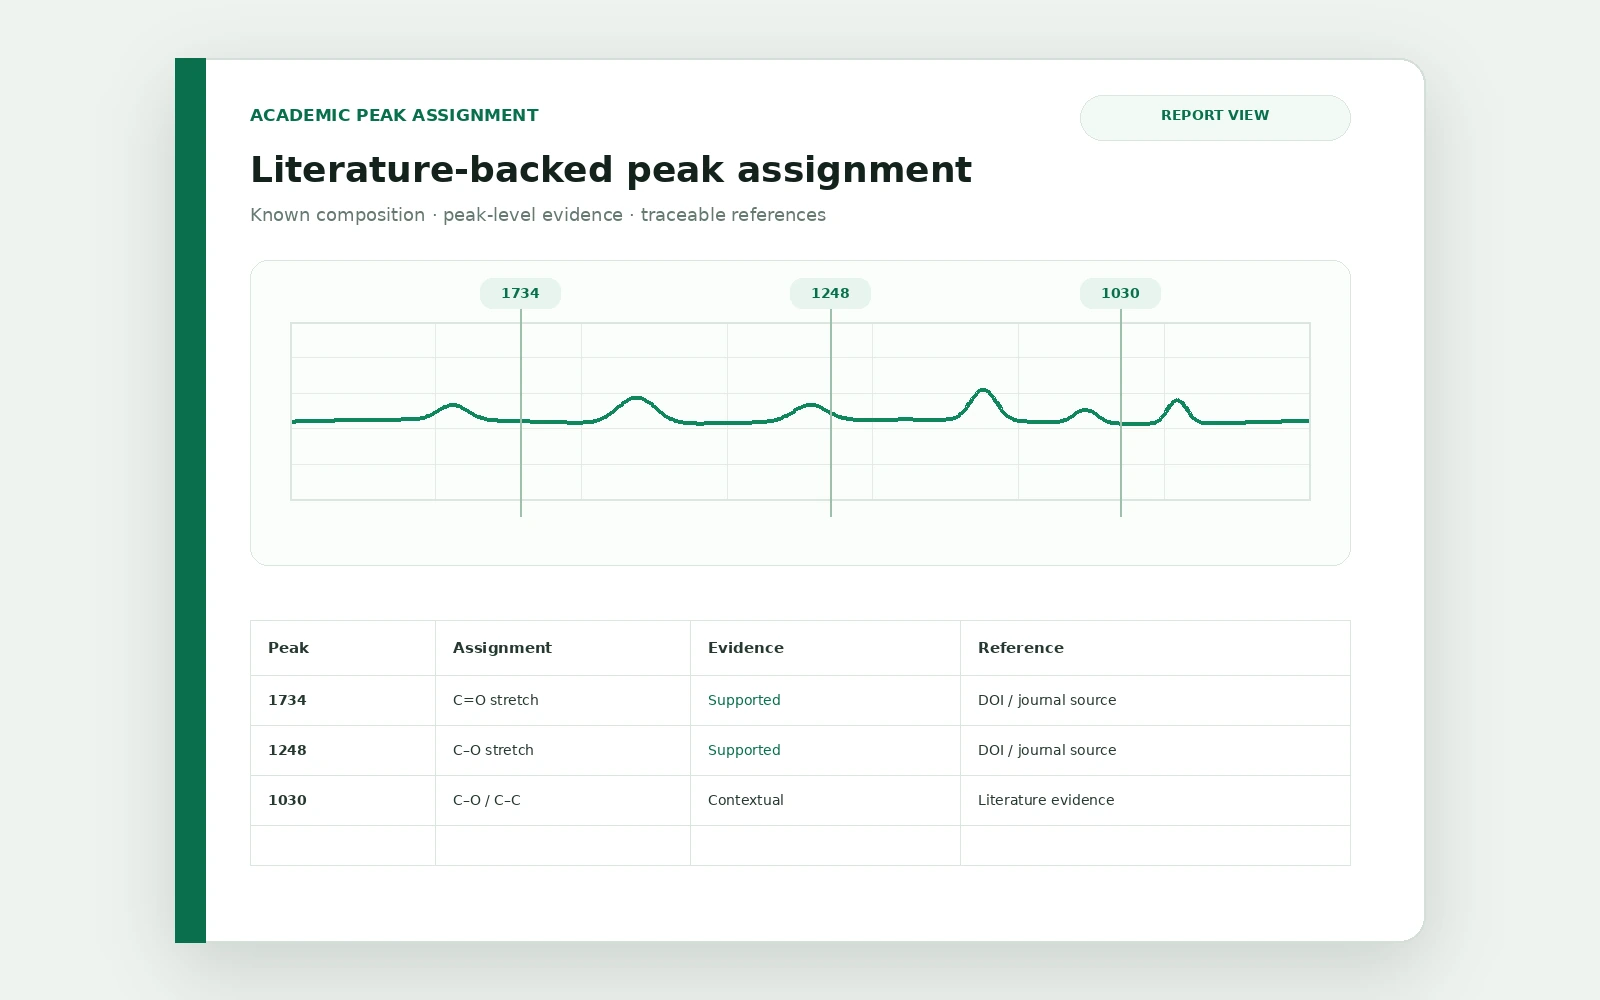
Every characteristic peak is mapped to functional groups and specific chemical bond vibrations, linked directly to peer-reviewed literature with traceable DOIs, and explicitly notes supporting bands, abnormal regions, and unresolved conflicts.

Peer-reviewed DOI citations attached

Evidence First, Verifiable Always

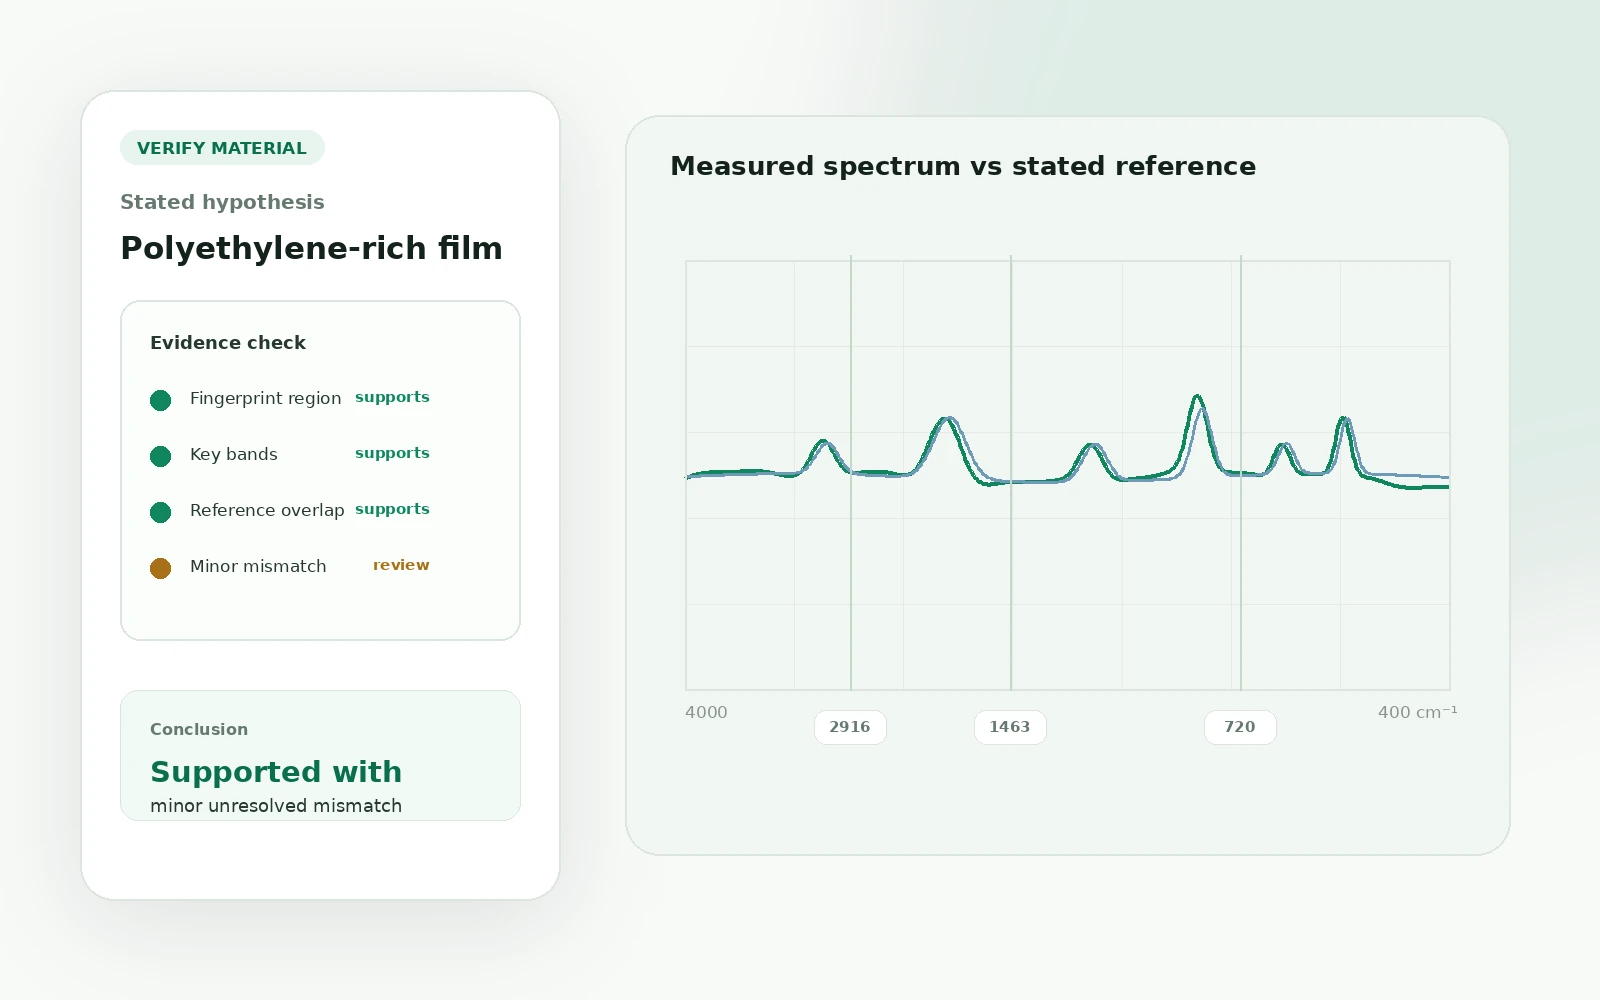
Review spectrum overlays, derivative matching, and DOI citations side-by-side with your measured data before accepting an analytical judgement.

Data security & open science

Free users contribute to open science. Paid users enjoy strict privacy.

We maintain clear, uncompromised boundaries between open academic sharing and confidential commercial research. You know exactly what happens to your data before you submit a spectrum.

Free Community Tier

Contribute to the Global Spectrum Library

For students, academic researchers, and non-confidential investigations who want free reference matching while helping the scientific community.

  • 100% free reference library search across all supported instrument formats
  • Valid sample background information required to prevent low-quality spam
  • Submitted spectra and background details incrementally enrich the open community library
  • Ideal for academic sharing, educational samples, and peer discovery
Paid & Enterprise Tier

Strict Confidentiality, Isolation & Zero Model Training

For corporate R&D, commercial testing, QC labs, and confidential intellectual property protected by NDAs and trade secrets.

  • Dedicated private data channel: never published to the public library
  • Strict guarantee: customer spectra are never used to train AI models
  • Commercial NDA and trade-secret compliance fully guaranteed
  • Available for air-gapped local offline deployment with zero network transfer
Reference search & analytical tools

Quick tools for spectrum search, verification, and history.

Access standalone reference search, hypothesis checking, past analysis history, and library domain coverage directly.

FTIR File Converter

Turn instrument files into open spectral data — one file, a batch, or entirely offline.

Convert supported native FTIR instrument files to CSV, JCAMP-DX or JSON while retaining available spectrum data, metadata and source information. Use it online for single files or batches, or choose a Local edition when files need to stay on your own computer or network.

SingleOpen one original instrument file, inspect the recovered curve and export it in an open format.
BatchConvert mixed supported files in one job and download the successful results together.
Local editionsChoose Personal for offline desktop use, Internal API for your organization's local workflows, or Platform/OEM for customer-facing software integration.
Instrument files.SPA · .SPC · OPUS · .SP · .SMF · .JWS · …
FTIR.fun convertercurve + metadata + source information
Open outputsCSV · JCAMP-DX · JSON
Solutions by organization

Find the FTIR workflow built for your organization.

Universities, QC laboratories, R&D teams, training providers, laboratory-software companies and scientific-information platforms use FTIR differently. Choose your organization to see what established tools already do, what FTIR.fun adds, and how to use or integrate it.

Research batch FTIR comparison and PCA view
Universities & Research Groups

Turn statistical differences into scientific interpretation

Keep replicates and group statistics, then connect PCA or distance patterns back to changed bands, peak differences and supporting literature evidence.

Explore Research & Academia
QC FTIR reference and incoming sample comparison
QC Laboratories & Quality Teams

Go beyond PASS/FAIL when a sample is different

Use qualified history and statistical comparison to find abnormal regions, then continue into peak-level interpretation and evidence for investigation.

Explore QC Evidence
Multi-stage formulation FTIR analysis project
R&D & Formulation Teams

Explain what changed as materials and formulations evolve

Keep controls, process stages and formulation changes together, then connect spectral differences to interpretable hypotheses and domain-specific evidence.

Explore R&D & Formulation
Instructor-to-learner FTIR training workflow
Training Providers & Educators

Build practical FTIR training around real spectra

Let learners make a real analytical judgement before revealing the reference explanation and evidence, with reusable cases that can be adapted to your course or industry.

Explore Training & Education
Laboratory record connected to structured FTIR analysis through API and MCP
LIMS, ELN & Laboratory Platforms

Add FTIR expertise without building it yourself

Embed reference search, evidence-backed interpretation, research or QC context, Image/PDF → spectrum and custom FTIR results through REST, OpenAPI or MCP.

Explore Laboratory Platforms
Published FTIR figure digitized, reviewed and compared with an experiment
Literature & Scientific-Information Platforms

Make FTIR figures computable and comparable

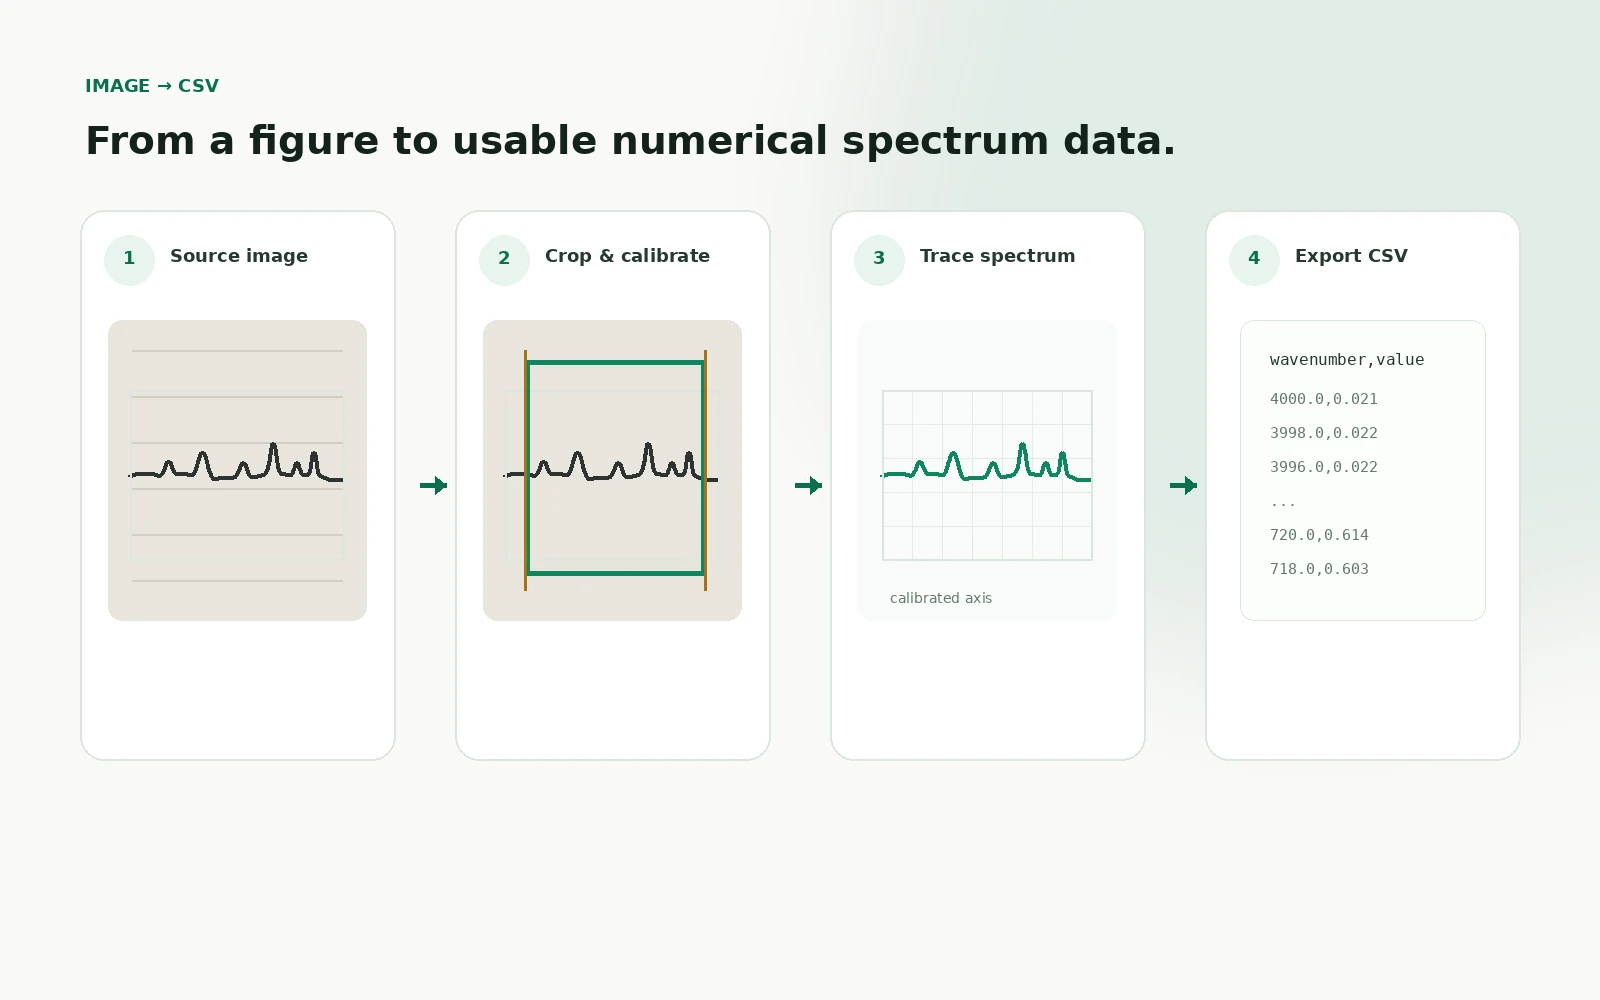
Turn published figures into numerical spectra, preserve DOI and figure provenance, compare them with experimental FTIR and carry peak-level evidence into downstream research workflows.

Explore Literature Platforms
Discussion & Expert Services

Need help with a difficult case? Choose open discussion or human support.

These are independent options designed for different data sensitivity levels. You can discuss non-confidential cases openly with peers, or commission a dedicated manual service from the FTIR.fun expert team under full confidentiality.

Open Community

Public Help Discussion

Publish your FTIR question openly so researchers, peers, and spectroscopy specialists can review the spectrum, discuss interpretations, and offer insights without cost.

Confidential Human Support

Online Requirement & Expert Services

Commission a dedicated analytical deliverable handled directly by the FTIR.fun scientific team with guaranteed turnaround time, full trade-secret confidentiality, and formal reporting.

Start with the spectrum you already have.

Upload a file, convert an instrument format, find a known reference, or recover numerical curves from spectrum figures.

Submit Requirement Form