
Instrument overlays, ELN records and chemometrics
Keep these specialist systems for acquisition, documentation and general modelling.
R&D teams do not need another spectrum viewer. They need to connect ingredients, concentrations, suppliers, curing, ageing and process conditions to reproducible spectral consequences and technically useful hypotheses.
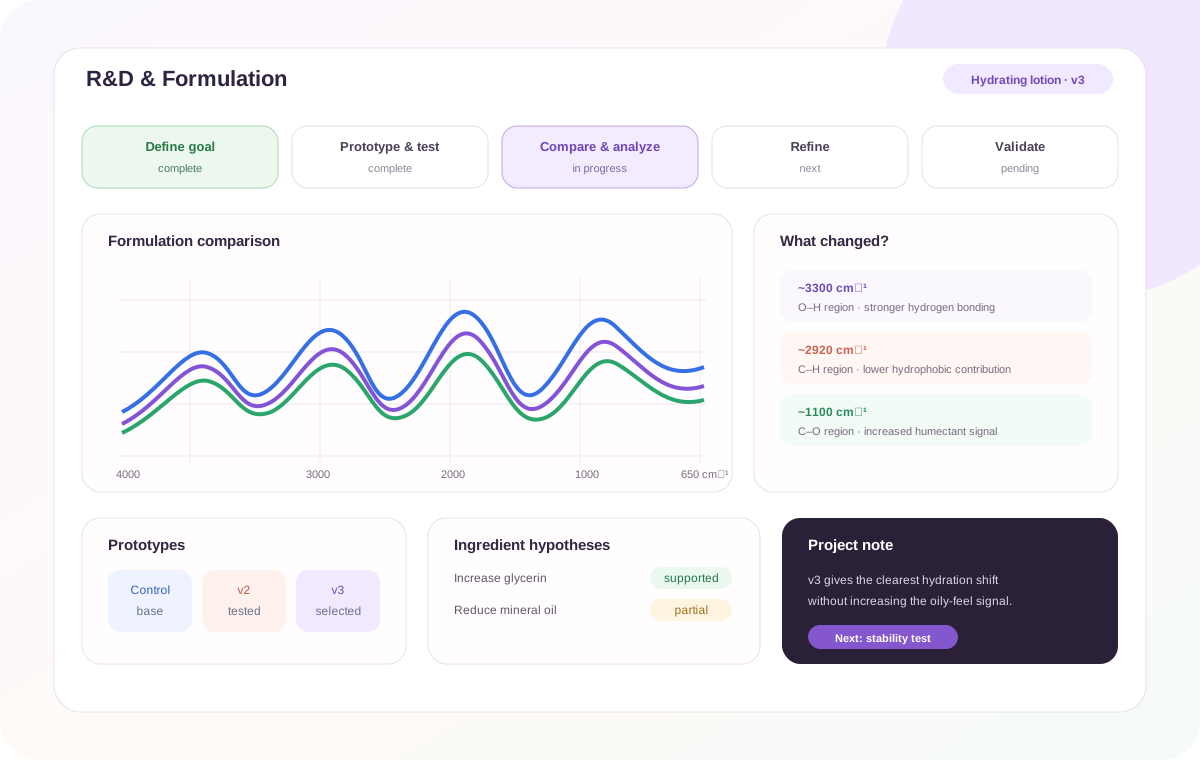
Changed variable → changed spectrum → chemical explanation → next experiment. Experimental context stays attached to the spectra, statistics, band-level interpretation and evidence instead of being reconstructed manually for every project.
Keep these specialist systems for acquisition, documentation and general modelling.
The link from experimental variable to changed bands, chemistry and literature evidence is usually manual.
Compare stages, locate the spectral consequences, explain them in formulation context and select the next discriminating test.
Define the control and record exactly what changes at each stage: ingredient, concentration, supplier, cure, ageing time, treatment or process condition.
Upload the spectra with their experimental context so comparisons follow the real sequence and the intended variable rather than file order.
Run the relevant pairwise, grouped and multivariate comparisons. Identify shifts, intensity or shape changes and new or missing bands linked to the changed variable.
Evaluate the spectral changes against known composition, process history, reference spectra, peak assignments and literature evidence. Compare competing explanations rather than treating every correlation as a mechanism.
Turn unresolved explanations into a concrete next test, then export the comparison figures, changed-band findings, technical interpretation, supporting evidence and project context for the R&D record.
| R&D task | Typical existing approach | FTIR.fun difference |
|---|---|---|
| Instrument acquisition / preprocessing | Vendor software remains the specialist environment. | Starts from the usable spectra and the R&D question. |
| Multivariate modelling / PAT | Dedicated platforms can be deeper for general modelling and process monitoring. | Connects modelled differences back to the responsible FTIR bands and material chemistry. |
| Project context | Often split across ELN, spreadsheets, instrument files and presentations. | Keeps the changed variable, spectrum, comparison, interpretation and evidence together. |
| Explain a material change | Depends heavily on senior analyst judgement after plots are produced. | Structures the judgement around actual changed bands, known formulation context and scientific evidence. |
| Next experimental decision | Often decided after another manual review cycle. | Turns competing explanations into the next discriminating characterization or formulation experiment. |
Bring a control and several known formulation or process changes. Judge whether the workflow connects the spectral differences to useful technical explanations and makes the next development decision faster and better supported.