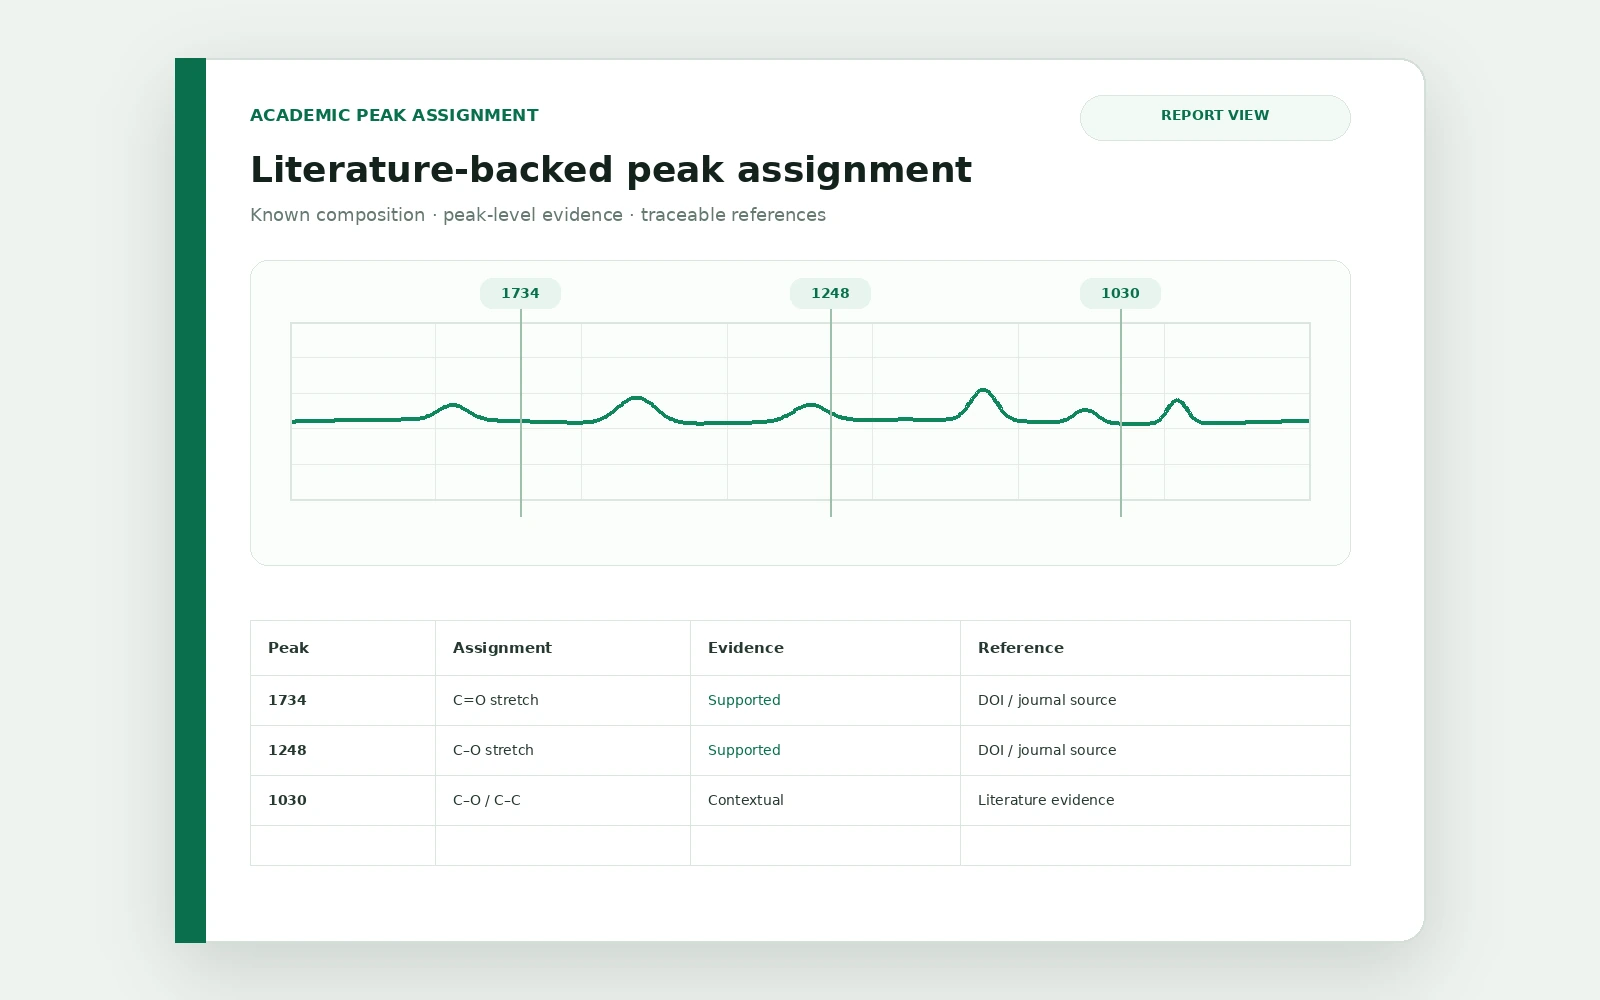
Use it for treatment and concentration series, material formulations, ageing or time-course studies, and biological groups where replicate behaviour matters to the conclusion.
Research workflows
Analyze an FTIR study series without losing the groups and replicates behind it.
For treatment groups, concentration series, formulations, time points or biological samples, keep the experimental structure visible while comparing spectra, multivariate patterns and peak changes. Export the numerical evidence for independent statistics, figures and manuscript work.
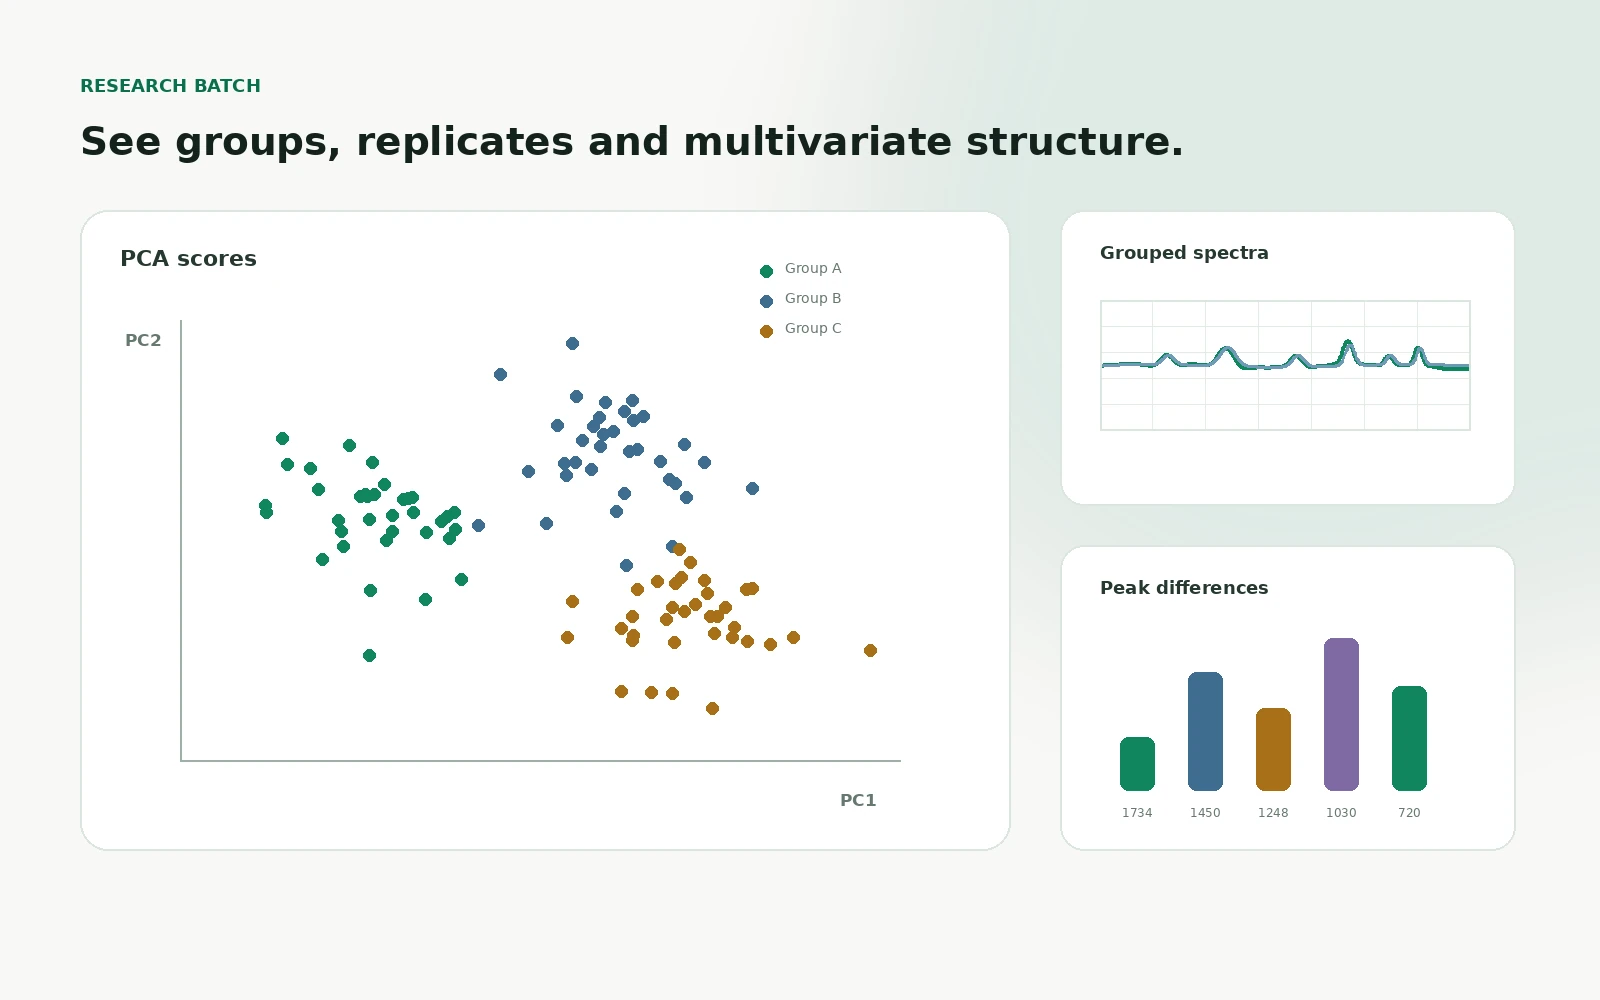
Inspect within-group consistency, between-group separation and the specific bands behind that separation instead of flattening several spectra into one visual comparison.
Keep sample grouping, numerical outputs and spectral differences together so figures can be supported by exported values, methods and evidence during manuscript preparation or review.
Research principle:Multivariate separation is treated as a pattern to explain, not as a chemical conclusion by itself. Use the spectral regions, peak changes and literature evidence to support the interpretation.
Study structure
Keep groups, replicates and individual spectra visible.
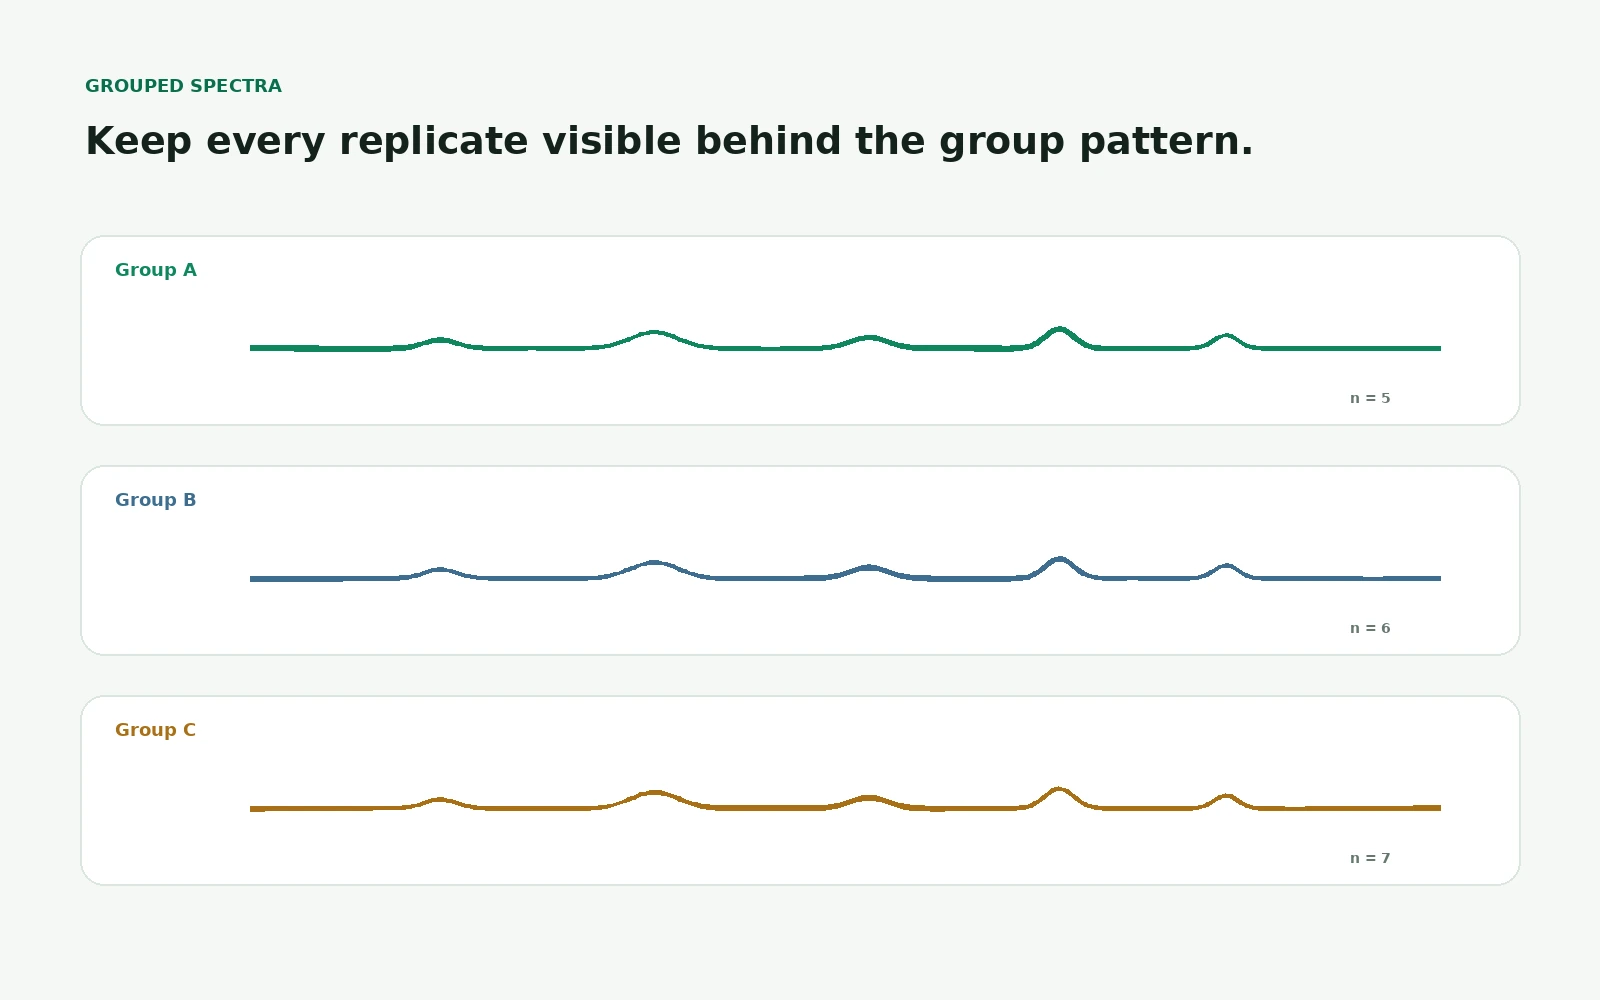
Build the analysis around the experiment you actually ran. Group spectra by condition, retain each replicate and review both group-level patterns and the individual spectra behind them.
- Grouped spectrum comparison
- Replicate-aware analysis
- PCA and numerical comparison where available
- Peak-difference analysis
- Numerical exports for independent statistics
Scientific interpretation
Move from statistical separation back to the bands that changed.
Use peak-level differences and literature evidence alongside group and multivariate results. This helps distinguish a visually separated score plot from a defensible interpretation of the underlying FTIR changes.
- Identify spectral regions contributing to group differences
- Review peak shifts, intensity changes, new bands and missing bands
- Connect assignments to literature evidence where available
- Export numerical results for downstream figures and statistics