
Plotting, preprocessing and multivariate statistics
Keep the specialist tools already used by the group.
Researchers already have instrument software, Origin, Excel and chemometrics. FTIR.fun connects grouped experimental spectra to changed bands, material-specific interpretation, literature evidence and publication-ready outputs in one workflow.
Experiment structure → statistics → changed bands → scientific explanation → reusable research output. The workflow stays tied to the actual controls, treatments, concentrations, time points and replicates instead of treating every spectrum as an isolated file.
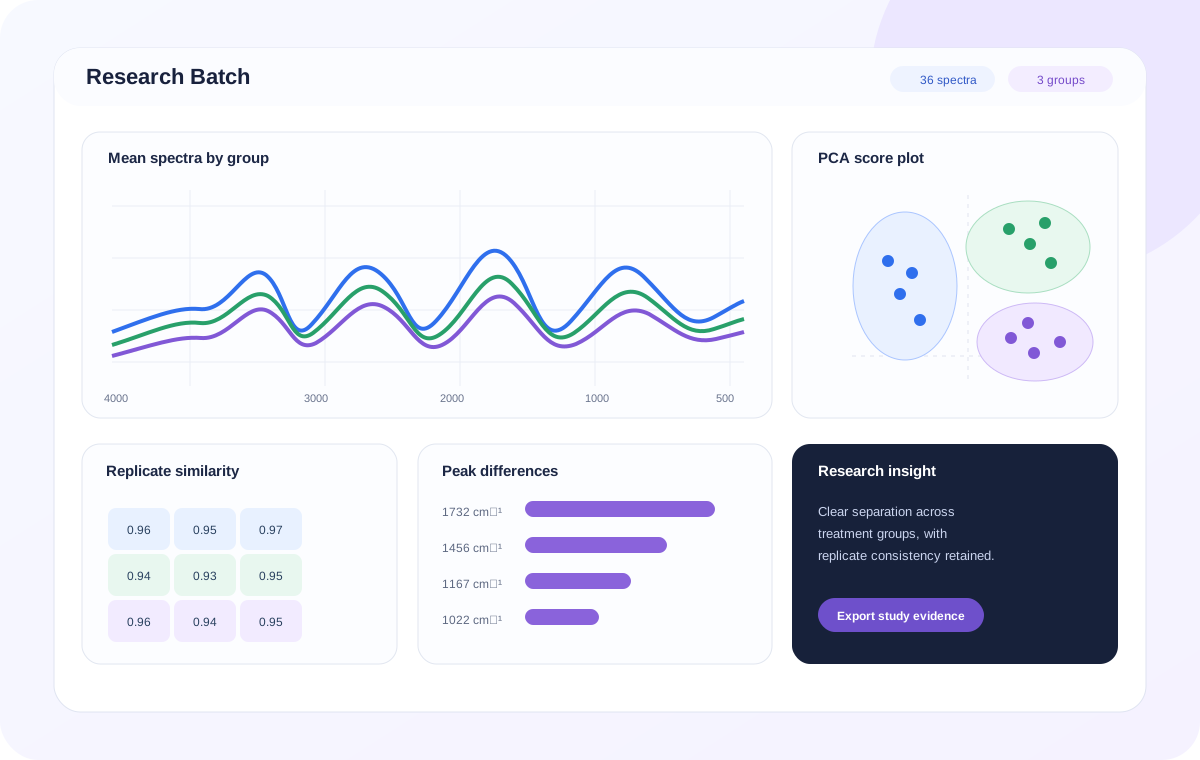
Keep the specialist tools already used by the group.
The difficult handoff is from a statistical result back to the actual spectra, chemistry and literature.
Group-aware analysis, spectral-difference localization, FTIR interpretation, DOI-linked evidence and exportable data stay connected.
Define control and treatment groups, concentrations, time points and replicates so the analysis follows the experiment rather than a folder of unrelated files.
Add the spectra, preserve labels and inspect replicate consistency before attributing a difference to the experimental variable.
Use similarity, PCA, SIMCA, clustering and differential views where appropriate, then identify the wavenumber regions and bands that actually drive the group separation.
Interpret shifts, intensity and shape changes, new or missing bands using the material context, reference spectra, peak assignments and DOI-linked literature evidence.
Produce publication-ready comparison figures plus the numerical spectrum data, changed-band table, statistical findings, interpretation and supporting references needed for a paper, thesis or supplementary dataset.
| Research task | Typical approach | FTIR.fun difference |
|---|---|---|
| Overlay / preprocessing | Instrument and plotting packages are mature. | Keeps preprocessing connected to the downstream scientific question rather than positioning it as the differentiator. |
| PCA / SIMCA / clustering | Dedicated chemometrics packages can be deeper for general modelling. | Returns from the statistical model to the spectra and identifies the bands responsible for the observed pattern. |
| Explain group differences | Researchers manually move among plots, spectra, frequency tables and papers. | Connects changed bands directly to material-context interpretation and supporting evidence. |
| Paper figure comparison | Often remains visual when raw XY data are unavailable. | Recovers the literature curve as numerical data and compares it directly with the user's experiment. |
| Research output | Figures, tables, scripts and citations are assembled separately. | Exports the comparison, numerical data, changed-band findings and evidence as one reusable research package. |
Use a completed or ongoing study and judge whether FTIR.fun identifies the important spectral changes, explains them with less manual work and produces material the group would actually reuse in a publication or research discussion.