RESULT PAGE

heteroaromatic carbonyl-containing organic material, possibly sulfur-containing

View the report above. Use the comments below if you need follow-up discussion.

Result No.: 20250807085124539752668 Owner: publicuser Comments: 1
FTIR Analysis Report

heteroaromatic carbonyl-containing organic material, possibly sulfur-containing

Sample & Measurement Parameters

Report No. 20250807085124539752668
Date 2025-08-07 08:22:04
Spectral Range (cm⁻¹) [(650, 4000)]
Baseline AsLS baseline correction
Library match 0%

Identification Result

0%

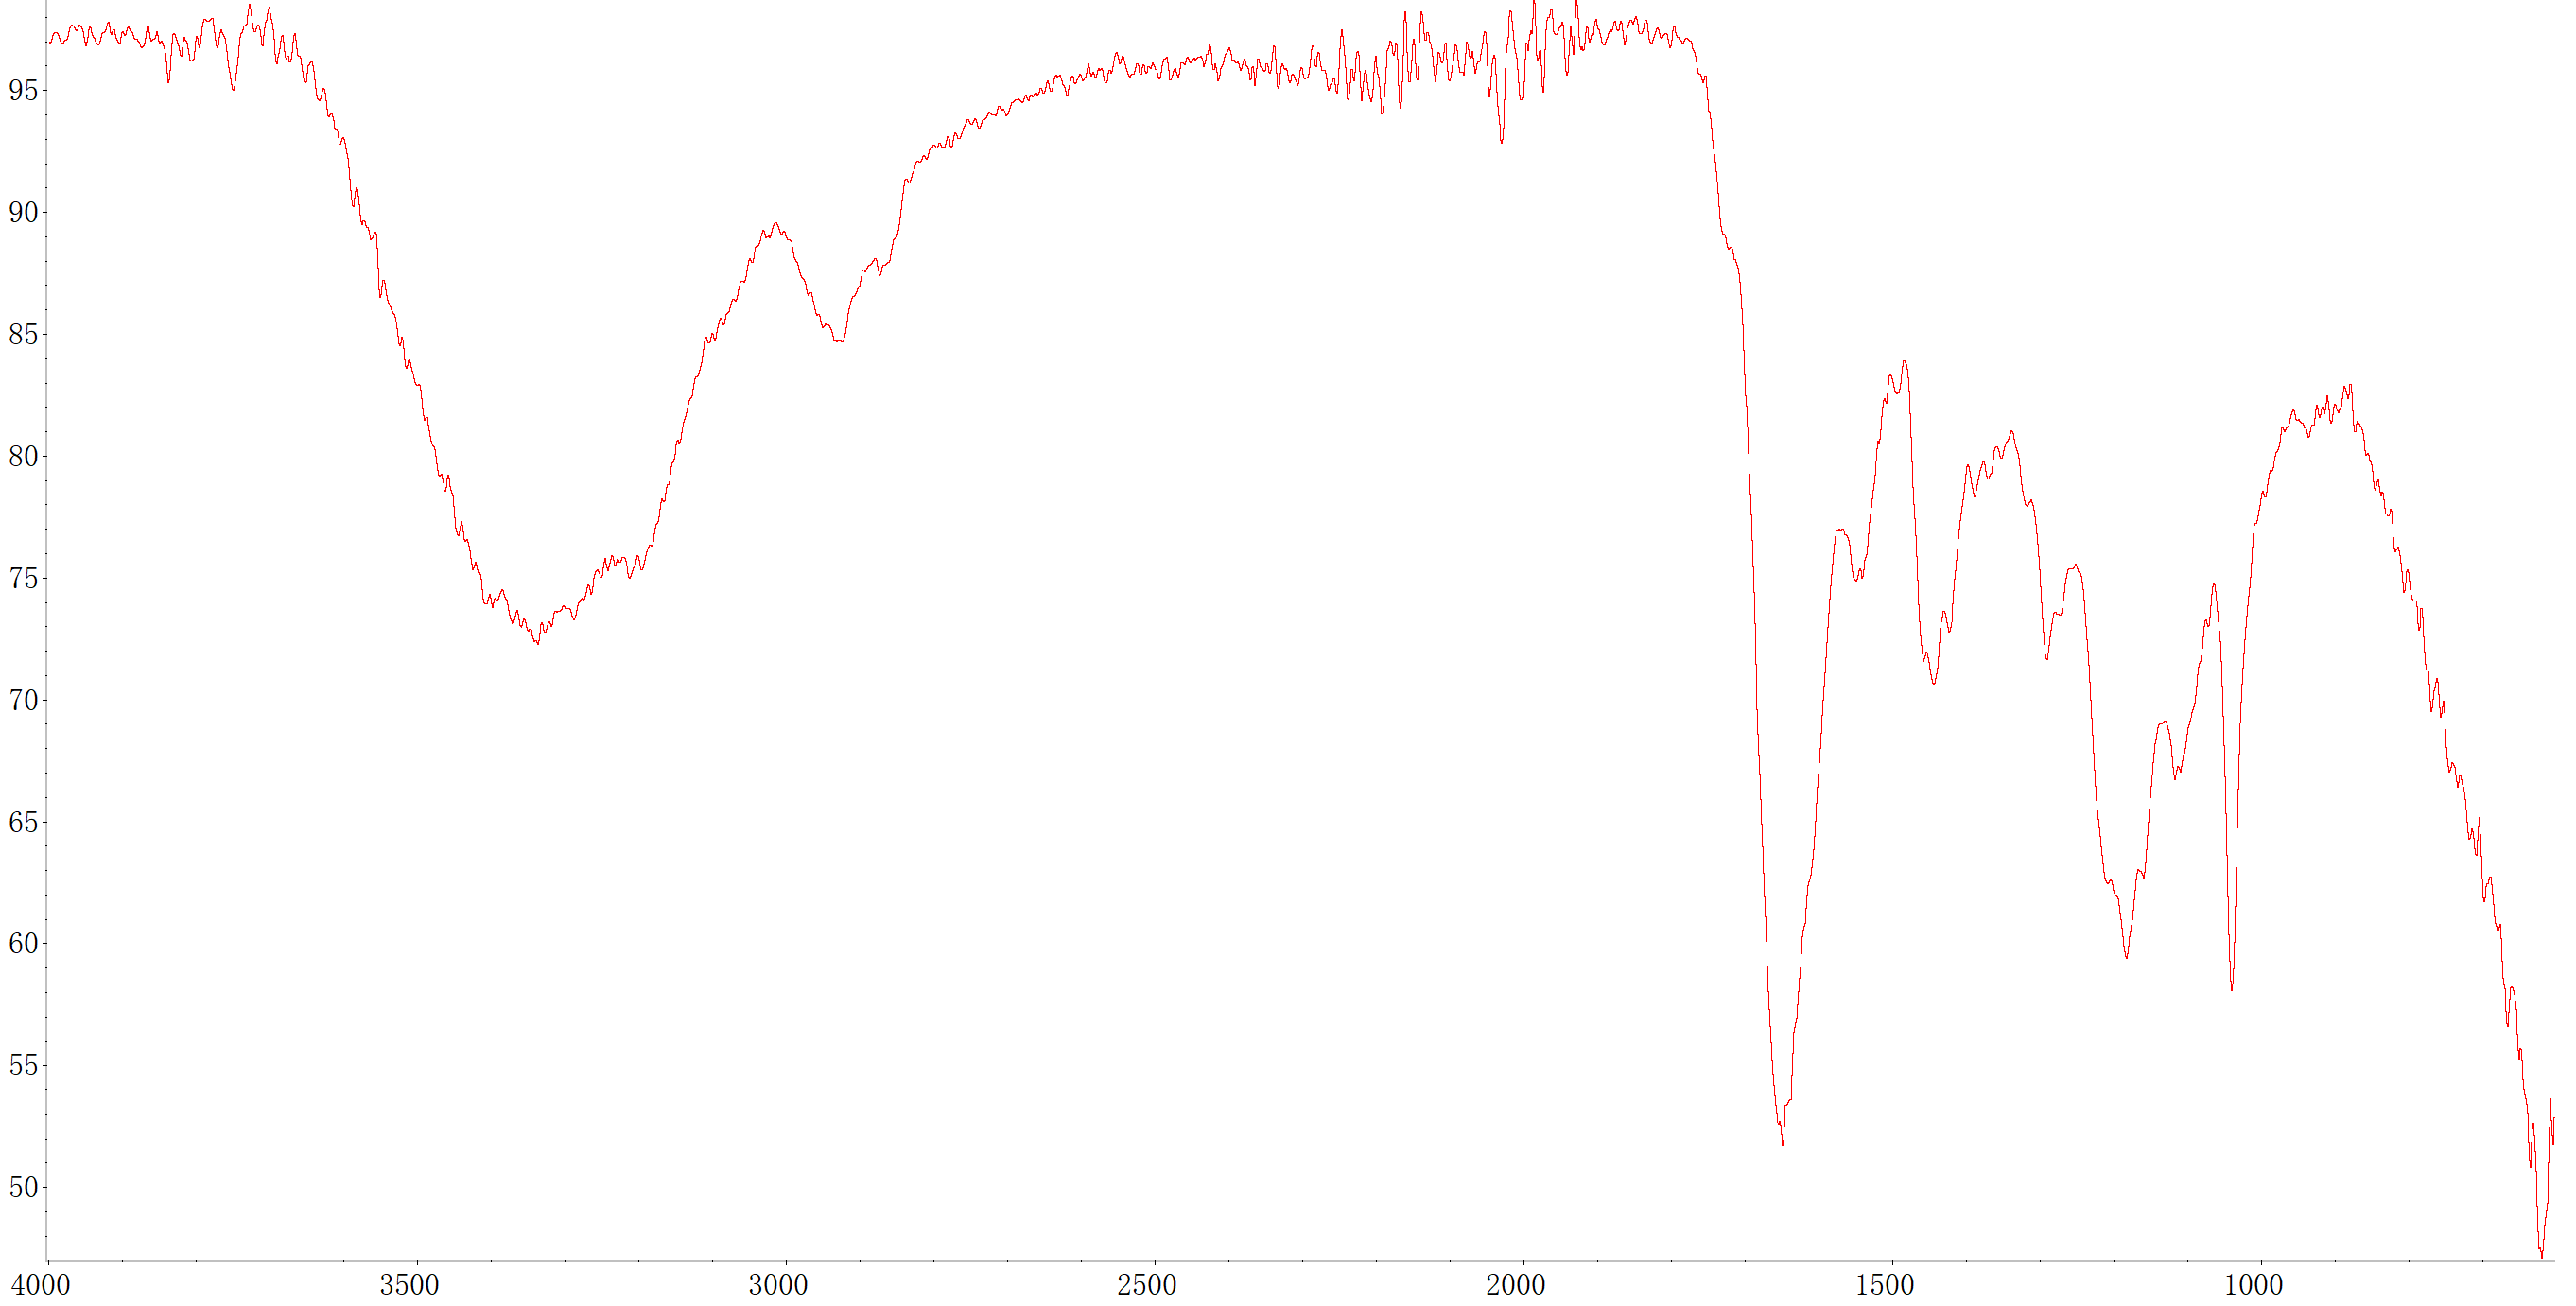
The current FTIR result does not support a firm compound-level identification. The library Top-1 hit is 1-(3-methylthiophen-2-yl)ethanone, but all reported library similarities are 0.000 and neither direct reference evidence nor related literature provides confirming support. The spectrum shows a band near 1648 cm-1 consistent with a conjugated carbonyl or other unsaturated functionality, multiple bands in the 666-806 cm-1 region that can be compatible with substituted aromatic or heteroaromatic ring out-of-plane modes, and broad high-wavenumber absorption at 3195-3409 cm-1 indicating hydrogen-bonded O-H and/or N-H character. Because these features do not securely match the specific Top-1 structure and the broad O-H/N-H region is not naturally explained by that candidate alone, the most chemically supportable conclusion is a broader heteroaromatic carbonyl-containing organic material, possibly sulfur-containing, rather than a confirmed single library entity

Detailed interpretation

  • Top library match: 1-(3-methylthiophen-2-yl)ethanone #267
  • All listed library similarities are 0.000, S-O the retrieval itself provides essentially no quantitative support for a specific compound identification.
  • No direct literature reference narrowed the result to the Top-1 candidate or to a closely related material.
  • No related-literature match was recovered to independently support the candidate.
  • Broad high-wavenumber absorption at 3195-3409 cm-1 suggests O-H and/or N-H functionality, which is not a clear fit to 1-(3-methylthiophen-2-yl)ethanone by itself.
  • The crowded 1862-2237 cm-1 region is atypical for a straightforward assignment to the Top-1 library compound and may reflect interference, mixture behavior, or nonmatching spectral content.
  • It remains unclear whether the sample is a single compound, a mixture, or a spectrum affected by background/interference.
  • The carbonyl assignment is plausible, but the exact functional group type cannot be fixed securely from the current evidence packet alone.
  • A sulfur-containing heteroaromatic component is plausible from the library lead, but it is not directly confirmed by the sample evidence.
  • The broad O-H/N-H region prevents a confident conclusion that the sample is the specific acetyl-substituted thiophene library compound.

Recommended next steps: Recollect the FTIR spectrum after checking background subtraction and atmospheric compensation, especially because the 1862-2237 cm-1 region appears unusually crowded. Inspect the sample for mixture behavior and, if possible, repeat FTIR on a cleaned or separated fraction. Confirm carbonyl type with complementary data such as Raman or GC-MS/LC-MS if the sample is molecular and extractable. If sulfur-containing heteroaromatic material is suspected, compare against authenticated reference spectra of thiophene- or benzothiophene-containing carbonyl compounds under the same measurement conditions.

Library Comparison

Match group:
Library spectrum will appear here.

Library Search Results — Top 15 Candidates

Rank Match % Compound SMILES Spectrum No. Action
Loading library candidates...

Peak Analysis

★ = Literature-supported assignment
# Wavenumber (cm⁻¹) Absorbance Assignment Citation Assignment status
1 · 1648 1.00 - - -
2 · 1039 0.66 - - -
3 · 1182 0.46 - - -
4 · 1443 0.42 - - -
5 · 1290 0.23 - - -
6 · 1116 0.20 - - -
7 · 1539 0.19 - - -
8 · 666 0.18 - - -
9 · 2923 0.18 - - -
10 · 2029 0.17 - - -
11 · 1388 0.16 - - -
12 · 769 0.14 - - -
13 · 1973 0.14 - - -
14 · 3195 0.14 - - -
15 · 1941 0.13 - - -
16 · 2003 0.13 - - -
17 · 2191 0.13 - - -
18 · 3749 0.13 - - -
19 · 744 0.13 - - -
20 · 1862 0.13 - - -
21 · 2167 0.13 - - -
22 · 698 0.13 - - -
23 · 2047 0.13 - - -
24 · 3409 0.12 - - -
25 · 717 0.12 - - -
26 · 806 0.12 - - -
27 · 2206 0.11 - - -
28 · 3837 0.11 - - -
29 · 2219 0.11 - - -
30 · 2155 0.11 - - -
31 · 2237 0.11 - - -
32 · 2144 0.11 - - -
33 · 2101 0.10 - - -
34 · 756 0.10 - - -
35 · 2119 0.10 - - -
36 · 3336 0.10 - - -
37 · 785 0.10 - - -

Appendix — Raw Spectrum

Raw sample spectrum
Generated by FTIR.fun — Report #20250807085124539752668 2025-08-07 08:22:04
Discussion

Comments and follow-up evidence

Use this area to continue the interpretation, ask questions, or add extra verification evidence.

The above shows the FTIR analysis results of a sp file uploaded by a user from Denmark. The original image and extracted CSV file are displayed below.1.png1.CSV
en&2
Submit Requirement Form