RESULT PAGE

methacrylate / carboxyl

View the report above. Use the comments below if you need follow-up discussion.

Result No.: 20250731025017256224800 Owner: publicuser Comments: 1
FTIR Analysis Report Low confidence

methacrylate / carboxyl

Sample & Measurement Parameters

Report No. 20250731025017256224800
Date
Spectral Range (cm⁻¹) N/A
Baseline AsLS baseline correction
Library match 29%

Identification Result

29%

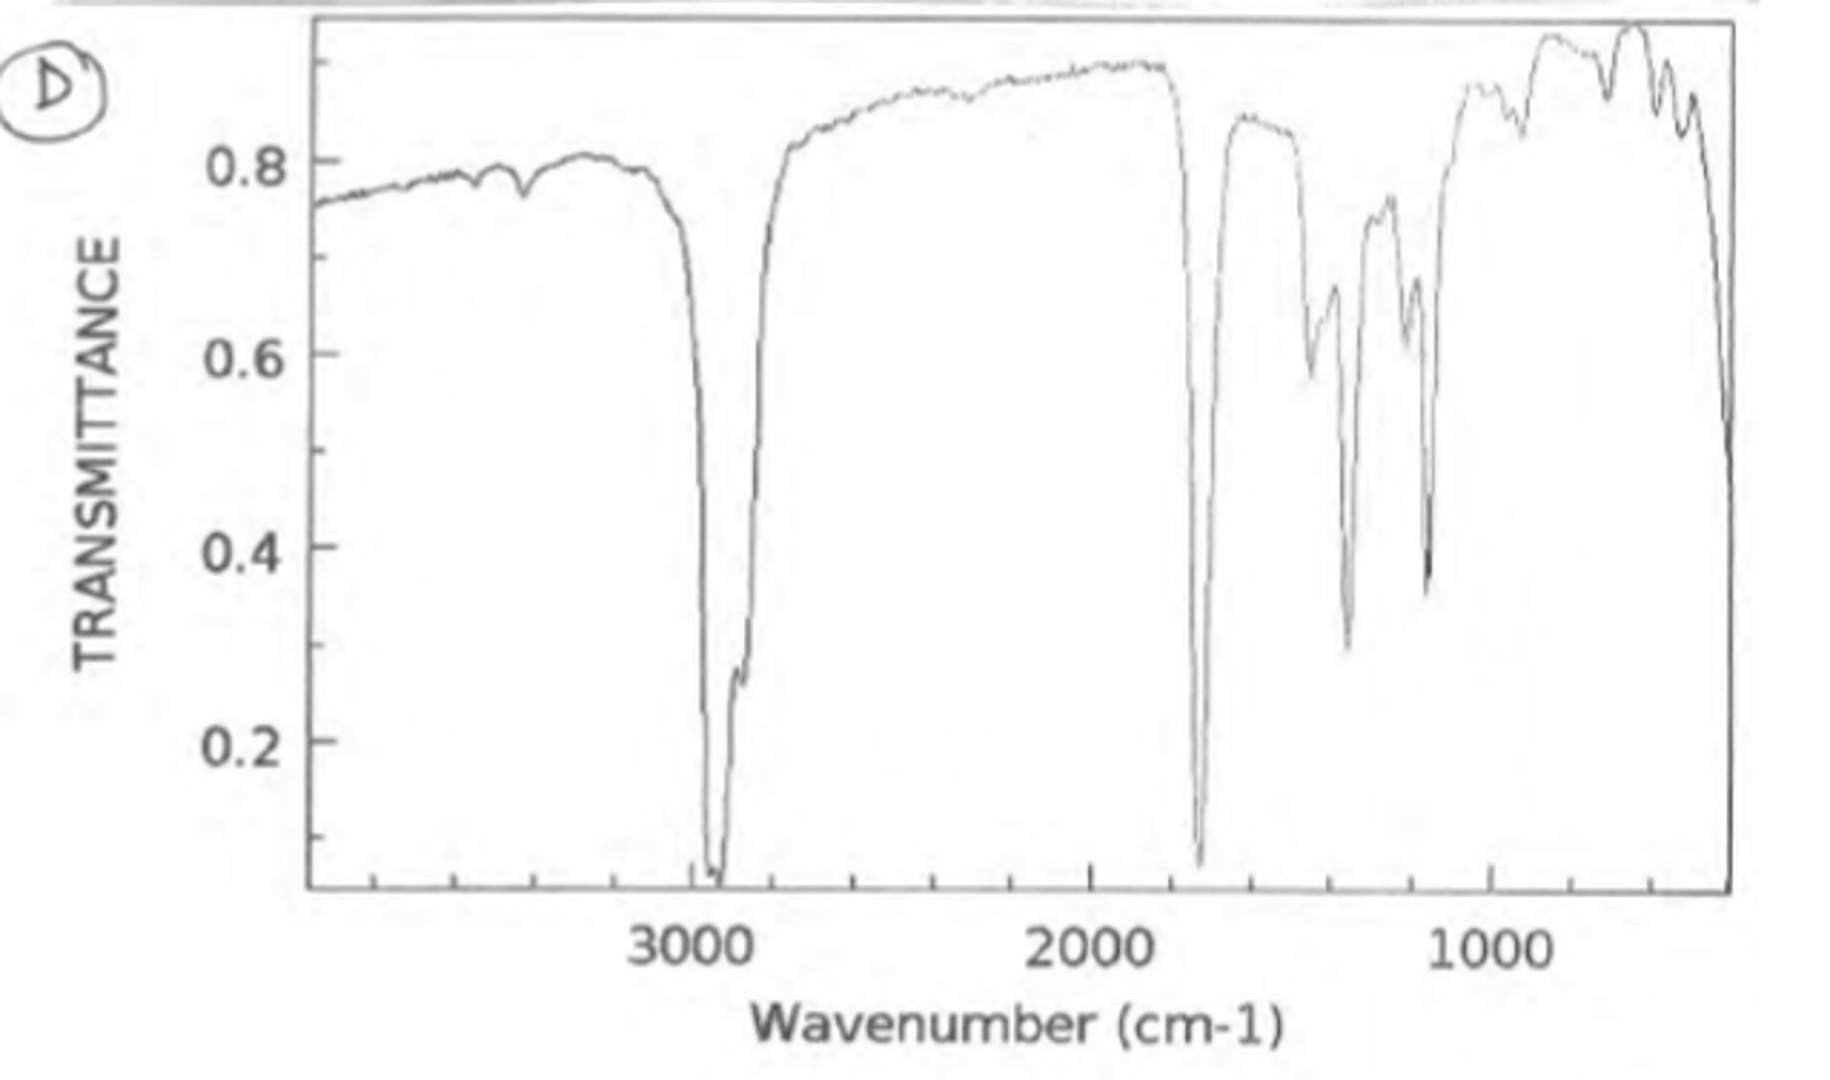
The FTIR spectrum of the sample is consistent with a methacrylate-based polymer or a related aliphatic ester material, displaying characteristic bands of ester carbonyl (C=O) stretching, C-O stretching, aliphatic C-H stretching, and methyl deformation FTIR In-Depth Interpretation was not selected for this task, so this section shows the library-search result only and no deep AI interpretation was run.

Detailed interpretation

  • Top library match: 2-Fluorophenol #19
  • The library search returned 2-Fluorophenol as the nearest match, but the extremely low similarity (0.0) and the lack of fluorine-characteristic bands indicate this is not the actual material; the chemical direction derived from the library consensus (methacrylate/carboxyl) is more reliable.
  • Some direct literature assignments, such as the asymmetric vibration at 1155 cm⁻¹ originally interpreted for PTFE [6], are not chemically compatible with the dominant ester pattern and are excluded from the final interpretation.
  • Without a definitive library match, the exact chemical identity cannot be determined; the material could be poly(methyl methacrylate) (PMMA), a related methacrylate copolymer, or a mixture of aliphatic esters.
  • The presence of minor amounts of other functional groups (e.g., residual acid, additives) cannot be ruled out based solely on these six peaks.
  • The direct evidence for the 1155 cm⁻¹ band remains ambiguous, with some sources attributing it to non-ester vibrations; its assignment to ester C-O is based on the overall spectral pattern rather than a single unequivocal reference.

Recommended next steps: Compare the spectrum with a reference spectrum of poly(methyl methacrylate) (PMMA) to verify the backbone structure. Perform complementary analysis by pyrolysis-GC/MS to identify the monomer composition and confirm the methacrylate character. If quantification of ester content is needed, use the carbonyl band intensity with appropriate calibration.

Library Comparison

Library spectrum will appear here.

Library Search Results — Top 15 Candidates

Rank Match % Compound SMILES Spectrum No. Action
Loading library candidates...

Peak Analysis

★ = Literature-supported assignment
# Wavenumber (cm⁻¹) Absorbance Assignment Citation Assignment status
1 · 2993 1.00 - - -
2 · 2976 0.96 - - -
3 · 1749 0.56 - - -
4 · 1367 0.20 - - -
5 · 1168 0.15 - - -
6 · 1155 0.13 - - -

Appendix — Raw Spectrum

Raw sample spectrum
Generated by FTIR.fun — Report #20250731025017256224800
Discussion

Comments and follow-up evidence

Use this area to continue the interpretation, ask questions, or add extra verification evidence.

The above shows the FTIR analysis results of a png file uploaded by a user from Papua New Guinea. The original image and extracted CSV file are displayed below.1 - 副本.pngtem.csv
en&2
Submit Requirement Form