
ANALYSIS RESULT
Results20250423235425107656881-3 docx Taiwan
Peak assignment, library matching and the evidence behind the conclusion.
FTIR Evidence Report
FTIR Spectrum Analysis Report
Material direction: -
Sample & Measurement Parameters
Report No.
20250423235425107656881-3
Date
2025-04-28 01:43:19
Spectral Range (cm⁻¹)
The default is the full wavelength range in this mode
Baseline
AsLS baseline correction
Multiple candidates are close — identity is uncertain; consider the material direction only.
Interpretation summary
FTIR In-Depth Interpretation was not selected for this task, so this section shows the library-search result only and no deep AI interpretation was run.
Detailed interpretation
- Top library match: Polypropylene+poly(ethylene:propylene) #25432
- Nearest library match: Polypropylene+poly(ethylene:propylene).
- The library ranking keeps this candidate at the top by spectral similarity.
Retrieved reference candidates
Library spectrum will appear here.
Library Search Results — Top 15 Candidates
| Rank | Match % | Compound | SMILES | Spectrum No. | Action |
|---|---|---|---|---|---|
| Loading library candidates... | |||||
Peak Analysis
★ = Literature-supported assignmentAppendix — Raw Spectrum

Discussion
Comments and follow-up evidence
Use this area to continue the interpretation, ask questions, or add extra verification evidence.
The user from Taiwan (IP: 2407::) uploaded a DOCX file containing three IR spectra. Swipe up to view the qualitative analysis of the third spectrum. The user also expressed intent to calculate sample thickness using interference peaks. Based on the spectra, the analysis was performed at wave numbers 3150 and 3290, yielding an interference peak difference (V₁ - V₂) of 140 cm-1 and ΔN = 1. By inputting the film's refractive index(n), the sample thickness (d) was determined.Here is the original spectrum of the sample extracted from the DOCX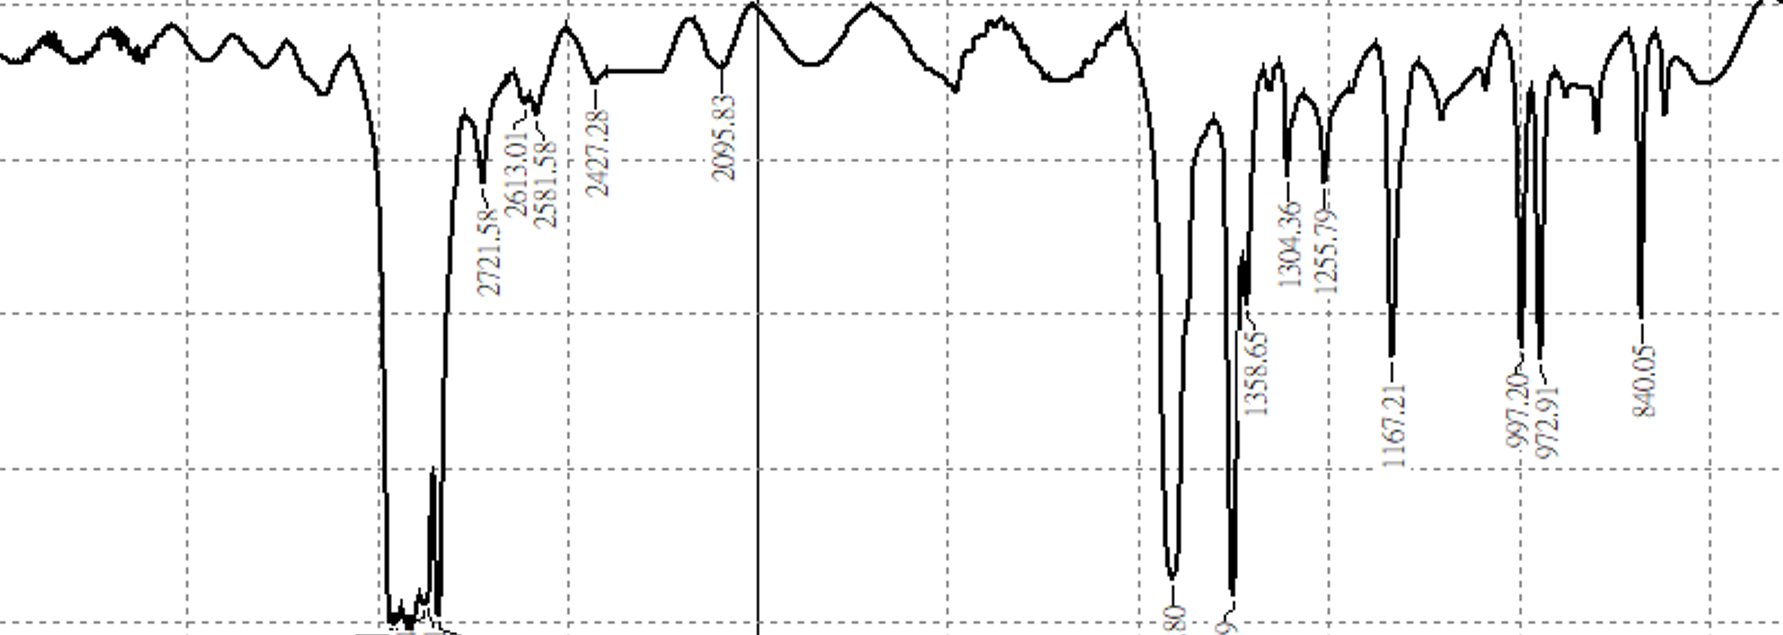
en&2