RESULT PAGE

fluorinated material with strong bands in the C–F stretching region

View the report above. Use the comments below if you need follow-up discussion.

Result No.: 20241213143128632293384 Owner: publicuser Comments: 2
FTIR Analysis Report

fluorinated material with strong bands in the C–F stretching region

Sample & Measurement Parameters

Report No. 20241213143128632293384
Date 2024-12-13 12:24:02
Spectral Range (cm⁻¹) [(650, 4000)]
Baseline AsLS baseline correction
Library match 0%

Identification Result

0%

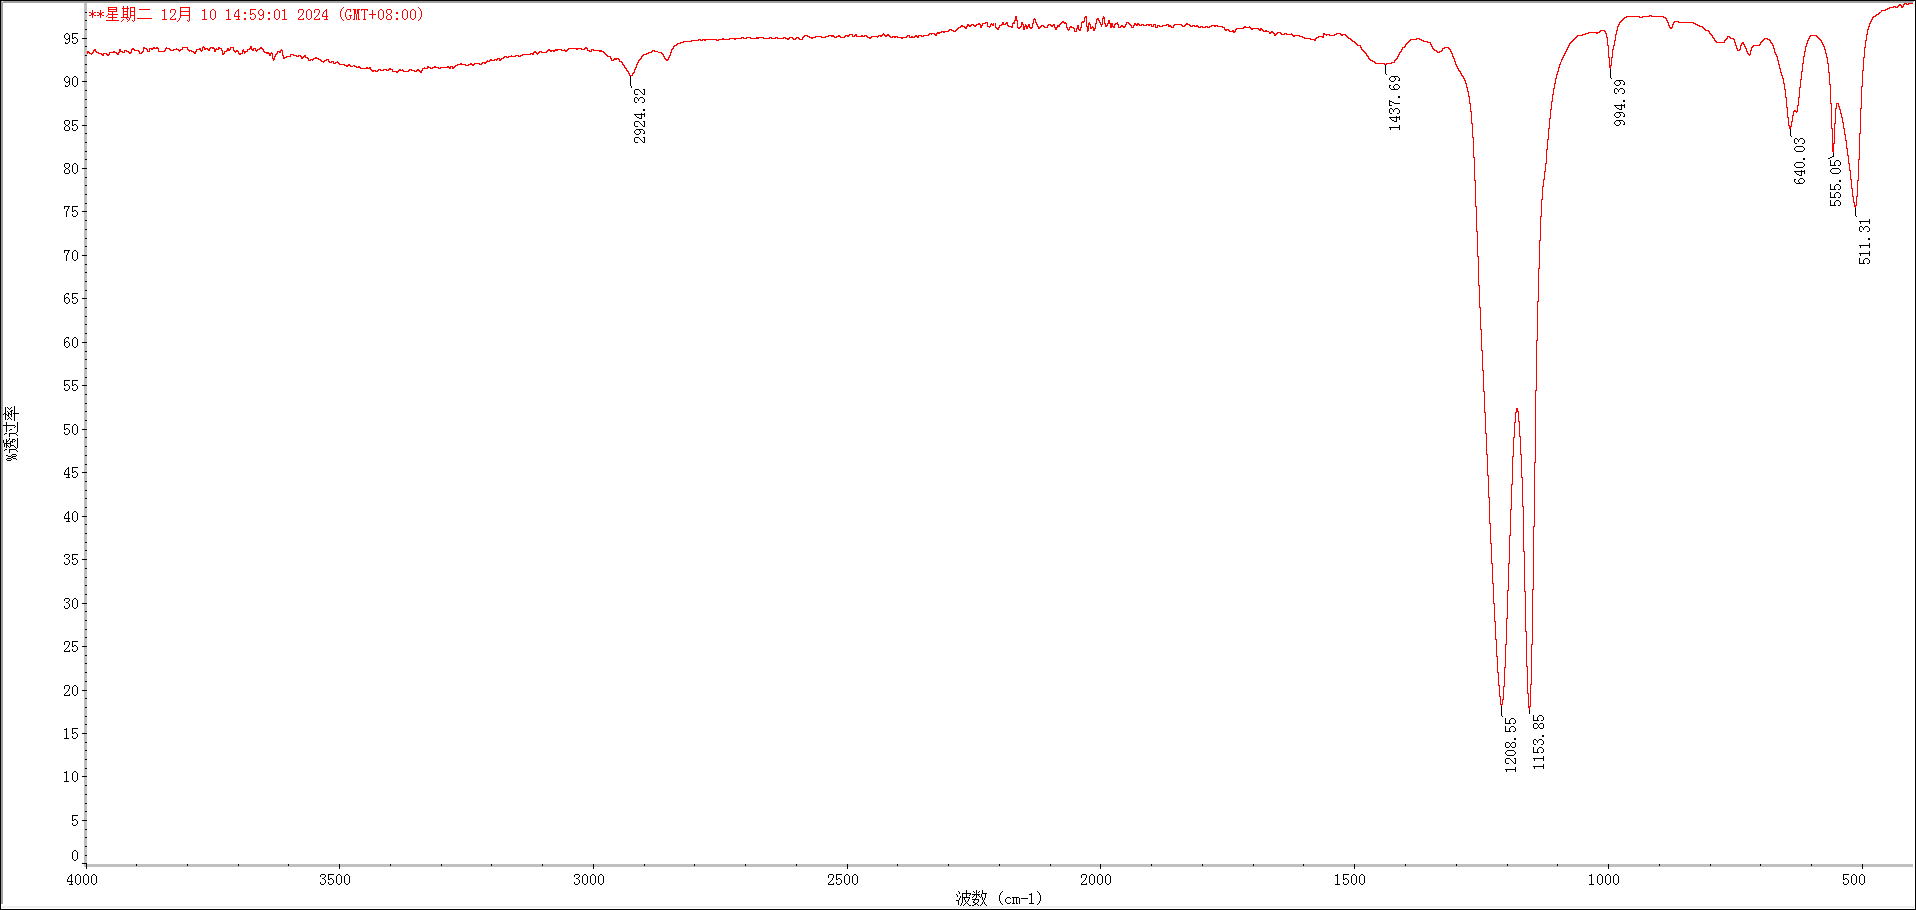
The current FTIR evidence does not support a firm compound-level identification. The sample shows only two reported bands, at 1214 and 1155 cm⁻¹, which are consistent with strong absorptions commonly found in fluorinated materials in the C–F stretching region. Although the nearest library hit is 2,2,3,3,3-pentafluoropropan-1-ol, the retrieval confidence is effectively absent and no direct or related literature evidence independently supports that specific substance. A broader assignment to a fluorinated material is therefore the most chemically supportable conclusion from the available spectrum

Detailed interpretation

  • Top library match: 2,2,3,3,3-pentafluoropropan-1-ol #63873
  • The library confidence is low, with all listed similarities reported as 0.000, S-O the top hit cannot be treated as a reliable identification.
  • The available peak list does not show additional characteristic bands that would be expected to support a narrow assignment such as an O–H stretch for an alcohol, N–H bands for an amine, or ring-associated bands for an aromatic compound.
  • The present spectrum is too sparse to distinguish among small fluorinated molecules, fluorinated aromatics, or fluorinated polymeric materials.
  • Because only two mid-IR bands are reported, it remains uncertain whether the sample contains additional unreported features outside this narrow region.
  • The specific top-hit name, 2,2,3,3,3-pentafluoropropan-1-ol, remains only a weak library suggestion rather than a supported identification.

Recommended next steps: Acquire the full FTIR spectrum over the standard mid-IR range and check specifically for broad O–H stretching near 3200–3600 cm⁻¹ if a fluorinated alcohol is being considered. Inspect the lower-wavenumber region for additional characteristic C–F patterning that can help separate small fluorinated organics from fluoropolymer-type materials. If enough sample is available, compare against an authentic spectrum of 2,2,3,3,3-pentafluoropropan-1-ol and against representative fluoropolymer references. Use a complementary method such as 19F NMR, GC-MS for volatile small molecules, or XPS/EDS for fluorine confirmation, depending on whether the sample is liquid, volatile, or solid.

Library Comparison

Match group:
Library spectrum will appear here.

Library Search Results — Top 15 Candidates

Rank Match % Compound SMILES Spectrum No. Action
Loading library candidates...

Peak Analysis

★ = Literature-supported assignment
# Wavenumber (cm⁻¹) Absorbance Assignment Citation Assignment status
1 · 1214 1.00 - - -
2 · 1155 0.59 - - -

Appendix — Raw Spectrum

Raw sample spectrum
Generated by FTIR.fun — Report #20241213143128632293384 2024-12-13 12:24:02
Discussion

Comments and follow-up evidence

Use this area to continue the interpretation, ask questions, or add extra verification evidence.

This is the search result for the file with the extension .tif uploaded by user 159:xx.xx.217 raw image:20241213143128632293384.png
en&2
Admin's comment was removed 1 year, 8 months ago
Submit Requirement Form