
Organize samples by group and replicate instead of comparing files one by one or flattening a study into a single overlay.
RESEARCH & ACADEMIA
Analyze FTIR study series with evidence you can carry into your research.
Compare groups, replicates and experimental conditions, inspect multivariate patterns and peak changes, and retain the methods and evidence behind the result.
Where it fits
For studies where a single spectrum is not the result.
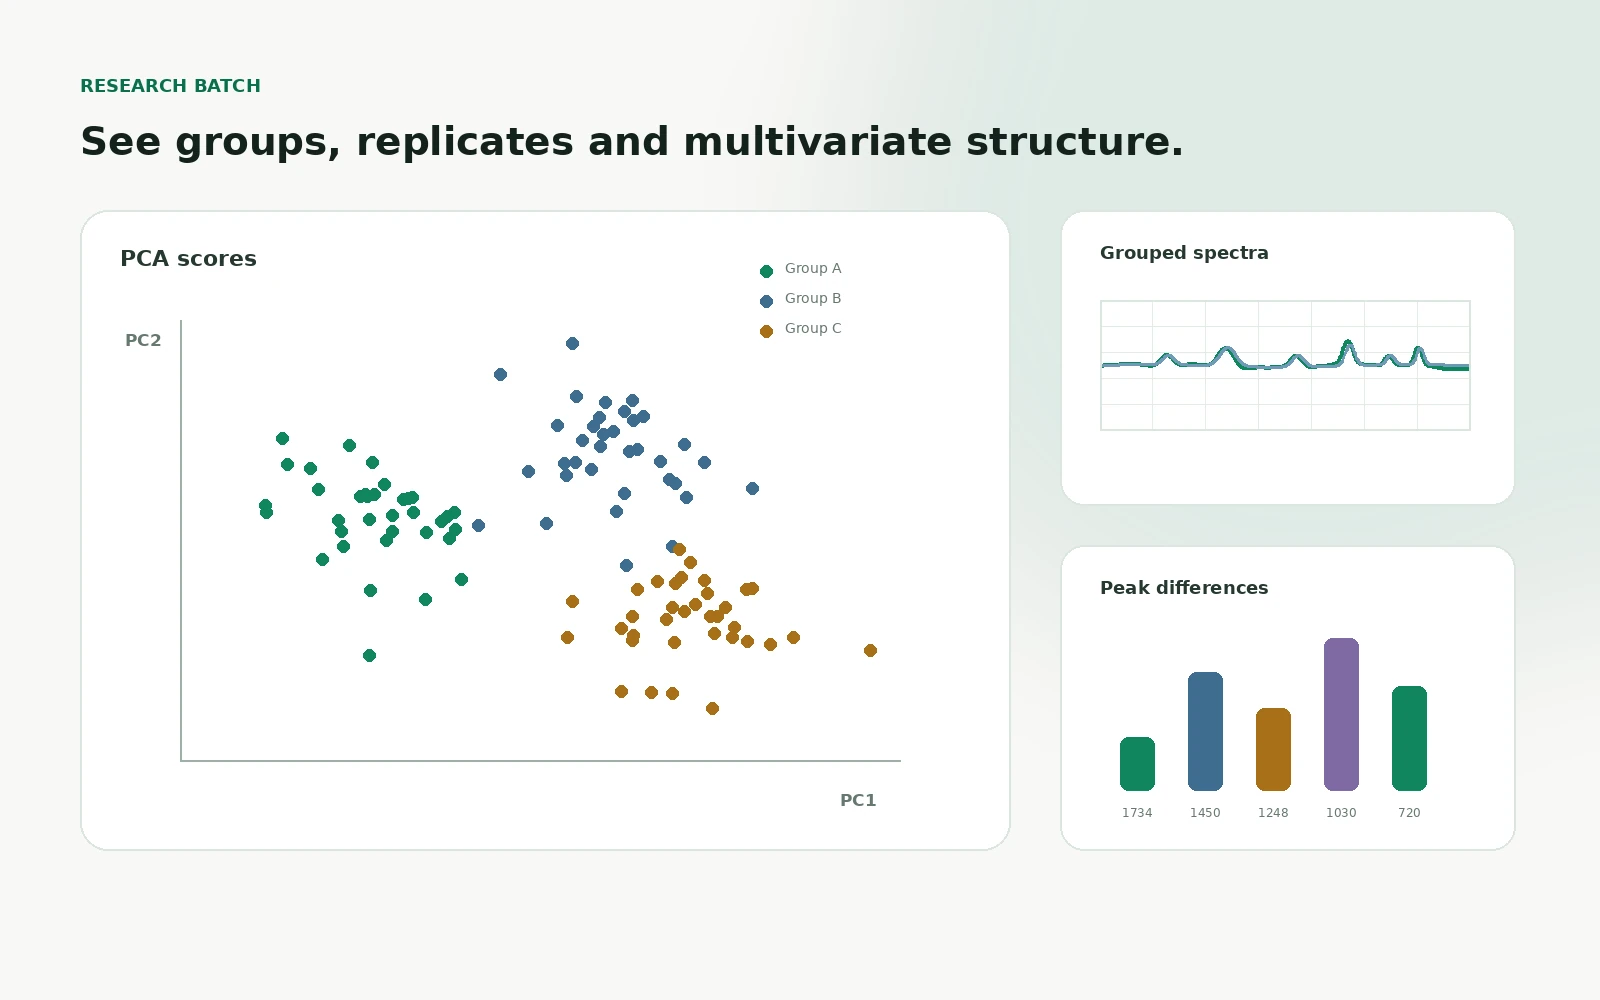
Use this workflow when your scientific question depends on a series: treatments, concentrations, formulations, time points or biological groups with replicates. The goal is to preserve the experimental structure while showing exactly where the spectra differ.
Review grouped spectra, replicate consistency, PCA and distance patterns, then return to the bands and numerical differences that explain the separation.
Export numerical results and keep the method and sample structure visible so co-authors and reviewers are not asked to trust a screenshot alone.
Typical use cases
- Treatment and concentration series
- Replicate-aware group comparisons
- Peak trajectories and publication evidence
What you get
- PCA, similarity and distance diagnostics
- Peak differences with numerical exports
- A reproducible methods and evidence record
Evidence / reproducibility
Keep the path that produced the result.
Inputs, methods, releases, deterministic metrics and interpretation can remain linked to the assessment so another reviewer can understand what was used, what changed and what remains uncertain.
InndataMethodBevisDecision