
Recover comparable spectral data from figures when the article does not provide a machine-readable spectrum and manual tracing would be slow or inconsistent.
LITERATURE & RESEARCH PLATFORMS
Turn FTIR figures in the literature into structured, comparable evidence.
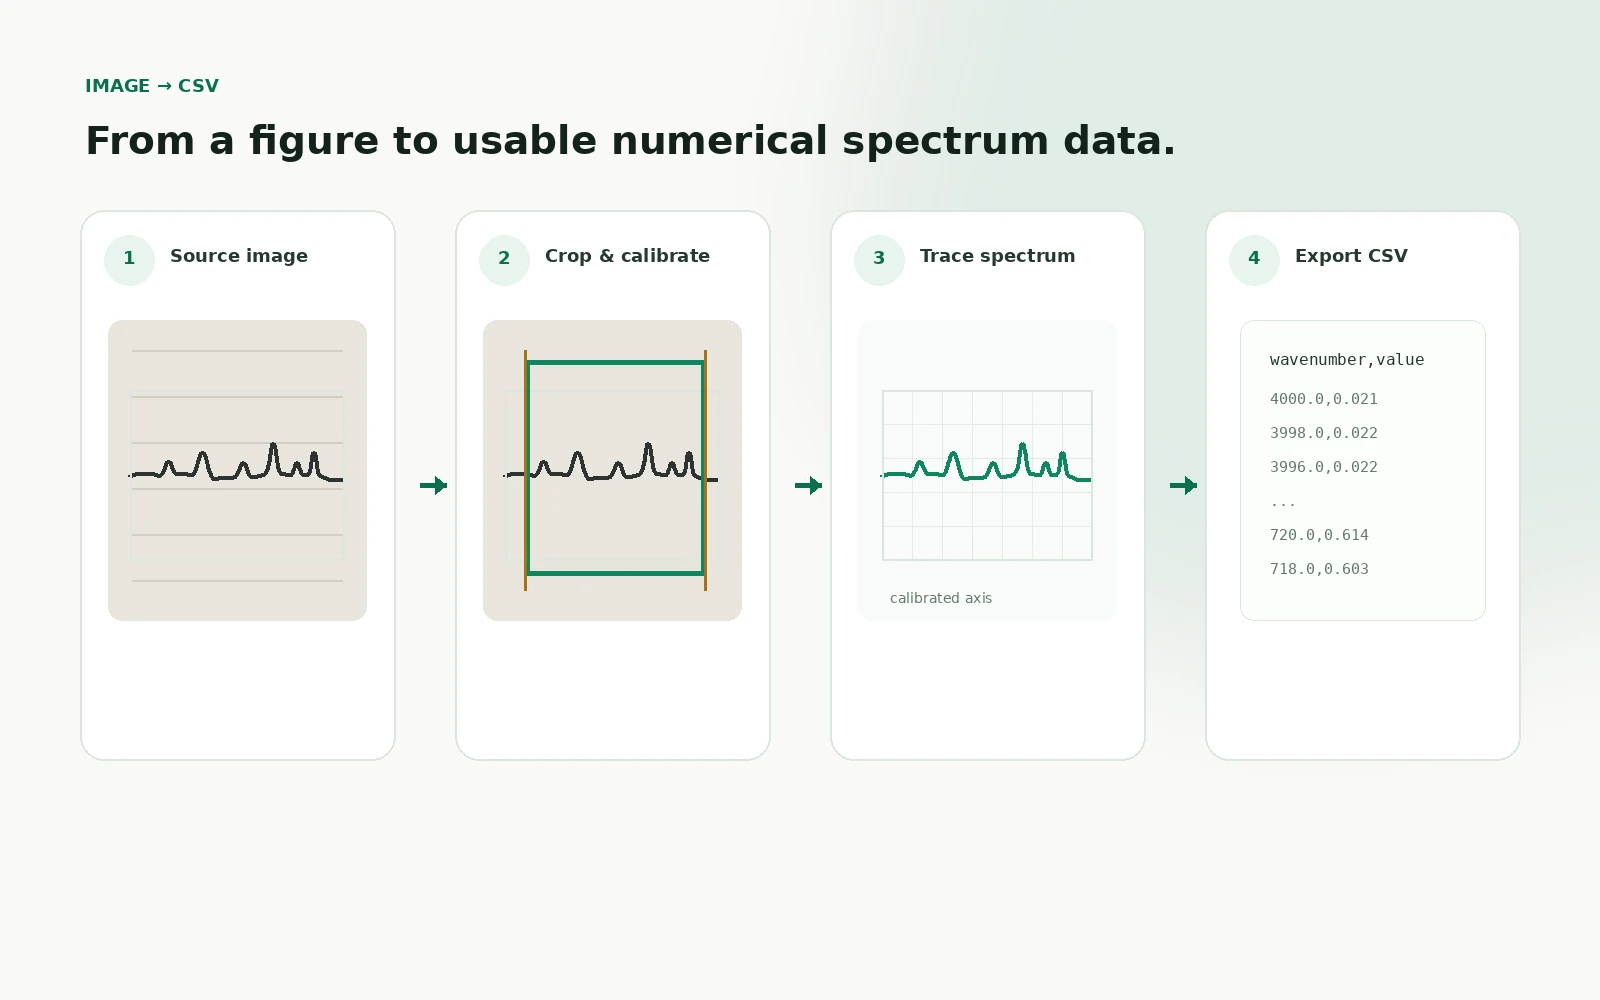
Digitize published spectra, apply quality gates, compare them with experiment and retain DOI, figure and extraction provenance in the resulting evidence record.
Where it fits
When the useful FTIR data exists only as a figure in a paper.
Use this workflow to convert a published spectral figure into numerical data, review extraction quality and compare the recovered curve with your own experiment while keeping DOI, figure and source-image provenance attached.
Digitize the curve, review ambiguous multi-curve or grid cases, then compare peak shifts, new bands and missing bands against experimental FTIR.
Give researchers numerical data they can overlay and inspect while preserving the DOI, figure, image hash and extraction state needed to understand where the recovered spectrum came from.
Core workflow
- Published figure to digitized spectrum
- Review ambiguous multi-curve or grid cases
- Compare shifts, new and missing bands
Evidence retained
- DOI, figure and image hash
- Digitization quality flags and review state
- Overlay, peak differences and structured export
Evidence / reproducibility
Keep the path that produced the result.
Inputs, methods, releases, deterministic metrics and interpretation can remain linked to the assessment so another reviewer can understand what was used, what changed and what remains uncertain.
EingabeMethodBeweisDecision