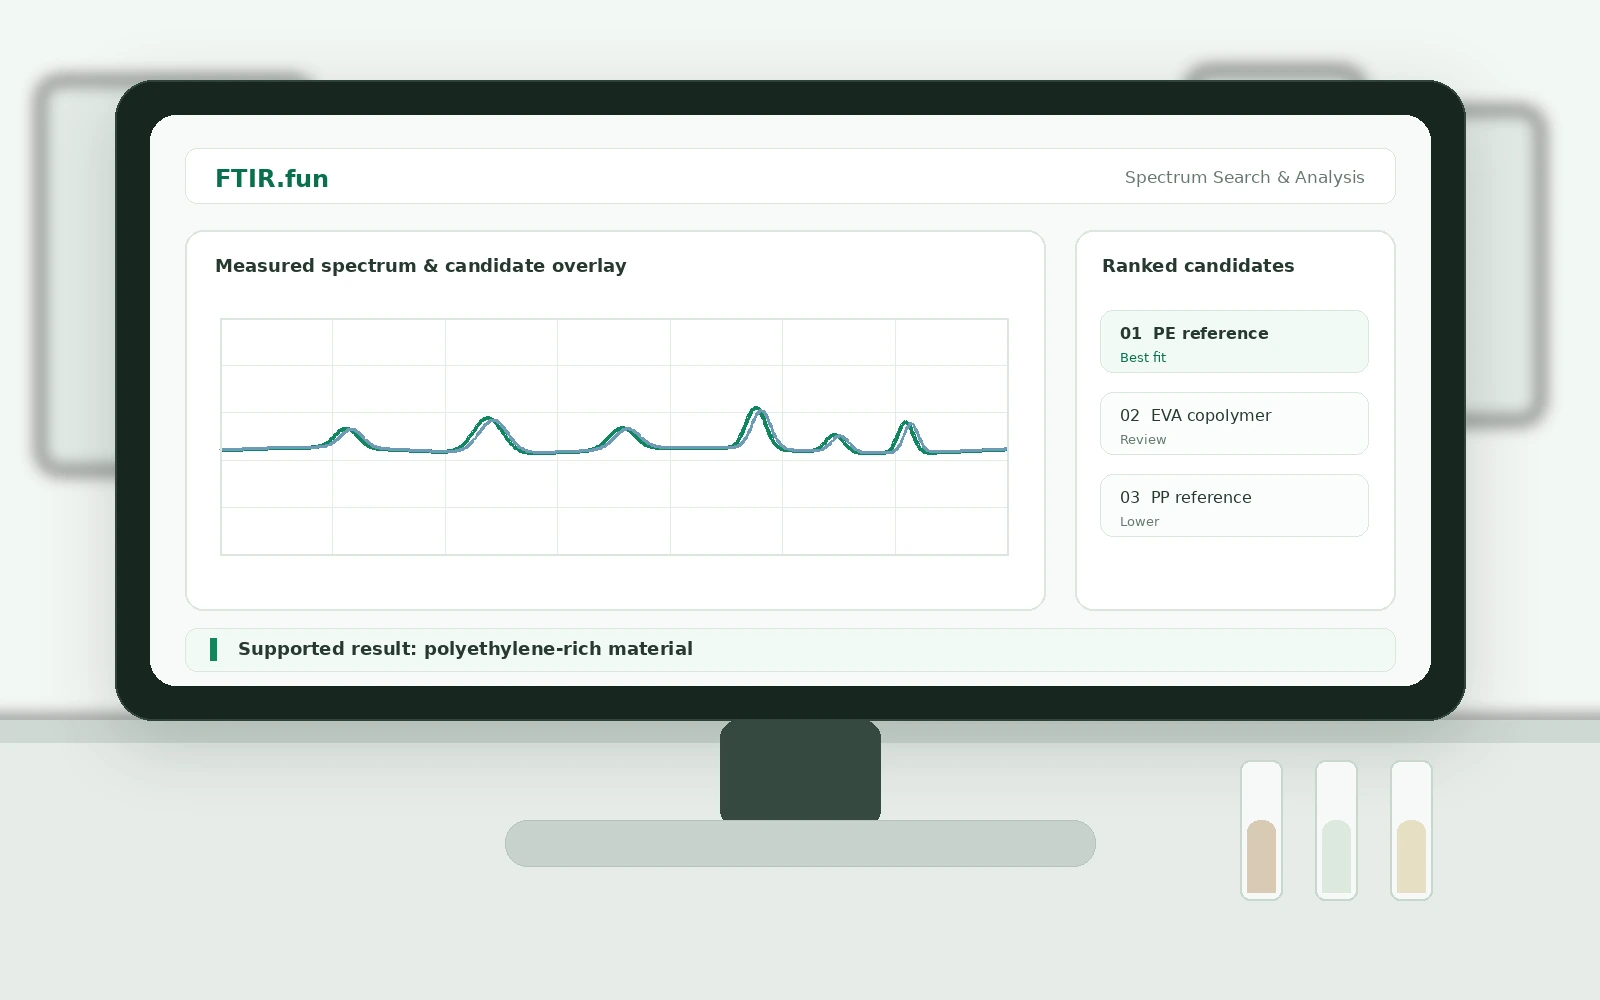
Use the continuously updated reference library, candidate comparison, peak analysis and AI-assisted interpretation for day-to-day FTIR questions.
FTIR analysis, interpretation and tailored workflows
Start with the FTIR problem you actually need to solve.
Use the automated platform for routine spectrum work, choose a dedicated research or QC workflow when the context matters, or ask us to adapt the analysis to a recurring laboratory, training, literature or software-platform use case.
When groups, qualified history, experimental stages or a published figure matter, use a workflow designed around that context instead of forcing every job into a single-spectrum screen.
For difficult samples, recurring industry questions, training programmes or software integration, the service can be adapted around the customer's actual workflow and deliverable.
01 · Core FTIR analysis
For a spectrum you need to identify, verify or understand
These are the direct-use services for routine FTIR work.
Spectrum Search & Analysis
Upload an unknown spectrum, retrieve relevant references, inspect the agreement and continue into peak-level interpretation instead of stopping at the top library hit.
→ Find a Reference SpectrumFind known reference records by spectrum number, CAS number, IUPAC name or product name.
→ Saved AnalysesReturn to previous analyses, candidate comparisons and interpretation without rebuilding the job from the original file.
→02 · Research and publication
For experiments and papers where the spectral meaning matters
Move beyond plots and generic peak tables by connecting the experimental comparison to the bands and literature that support the interpretation.
Research Series Analysis
Keep groups and replicates, quantify the pattern, return to changed bands and carry the interpretation into a paper, thesis or further statistics.
→ Academic Peak AssignmentFor known sample compositions, receive a peak-by-peak assignment table with relevant literature, DOI links where available, confidence and limitations.
→ Literature Spectrum ComparisonRecover a published FTIR figure as numerical data, keep the paper and figure source attached, and compare it with your own experimental spectrum.
→03 · QC and recurring material checks
For laboratories that need more than a single match score
Use known-good historical material as the comparison basis, quantify whether a new lot remains within the expected pattern and investigate where the spectrum changed.
QC Consistency & Exception Investigation
Compare incoming or production lots with qualified history, locate abnormal regions and organize the spectral findings for QA review and follow-up within the laboratory's existing SOP and quality system.
→ Specialist Two-Spectrum ComparisonFor incoming-versus-reference, failed-versus-good or another defined two-sample question, receive a focused comparison of the differences that actually matter.
→04 · R&D and material change
For formulation, process, ageing and troubleshooting work
Keep experimental changes tied to the spectra they produced, then move from the overlay to a technical explanation and the next useful experiment.
R&D & Formulation Workflow
Compare controls, ingredient changes, concentrations, process stages, treatment or ageing and keep the working explanation with the project.
→ Complex Sample InvestigationFor ambiguous unknowns, mixtures, contaminants, degraded materials or unusual spectra, combine targeted reference search, spectral interpretation, sample history and literature to narrow the strongest explanation.
→05 · Image and literature tools
When the only usable spectrum is trapped inside a figure
Convert spectral images into numerical data so they can continue into real FTIR comparison and analysis.
Image → Spectrum / CSV
Recover numerical FTIR data from a screenshot, scanned figure or paper image for downstream analysis.
→ Native FTIR Format ConverterConvert original instrument data to CSV, JCAMP-DX or canonical JSON while keeping parser-exposed metadata and provenance visible.
→ Published Figure → Experimental ComparisonKeep DOI and figure source attached to the recovered curve, then review peak shifts, new bands and missing bands against your experiment.
→06 · Solutions for organizations
Use FTIR.fun in the way your organization already works
These pages are organized by customer type so a university, QC laboratory, software platform or training provider can see the workflow that fits its own users.
Universities & Research Groups
Study-series analysis, spectral interpretation, literature support and research-specific adaptations.
→ QC Laboratories & Quality TeamsQualified-history comparison, statistical exception review and spectral investigation support alongside existing SOP and quality systems.
→ R&D & Formulation TeamsMaterial-change interpretation and recurring workflows adapted to formulation, process or material systems.
→ Training Providers & EducatorsHands-on cases built from real spectra, reusable across cohorts and adaptable to the provider's own course or industry.
→ LIMS, ELN & Laboratory PlatformsAdd specialist FTIR search, interpretation and selected workflows inside software your users already know.
→ Literature & Scientific-Information PlatformsTurn FTIR figures in papers into numerical spectra that can be compared and interpreted inside literature or research products.
→07 · Access and customization
Browser, instrument computer, API, MCP or a tailored workflow
The access method is chosen around the customer's environment. For recurring needs, we can adapt inputs, result fields, analysis steps and the way the capability is presented to the end user.
Instrument Computer Access
Use browser, Launcher or Gateway options according to the laboratory's network constraints.
→ REST, OpenAPI & MCPCall FTIR capabilities from laboratory, research or AI software without making the interface itself the product.
→ Custom FTIR Service or WorkflowDescribe the real task, users and output you need. We can assess whether an existing service fits or whether a focused custom workflow is the better solution.
→Professional support
Have a difficult case or a recurring workflow that does not fit a standard service?
Send the spectra, sample context and the decision or deliverable you need. The work is scoped around that real analytical problem rather than around a generic menu of features.