RESULT PAGE

aromatic polyurethane

View the report above. Use the comments below if you need follow-up discussion.

Result No.: 20250915150840523821501 Owner: publicuser Comments: 1
FTIR Analysis Report Low confidence

aromatic polyurethane

Sample & Measurement Parameters

Report No. 20250915150840523821501
Date
Spectral Range (cm⁻¹) N/A
Baseline AsLS baseline correction
Library match 29%

Identification Result

29%

The sample spectrum is consistent with an aromatic polyurethane material. The strong carbonyl band at 1726 cm⁻¹ is characteristic of urethane C=O stretching. Aromatic ring vibrations appear at 1604 cm⁻¹ and 1510 cm⁻¹, while ester‑type C–O stretches are observed near 1248 cm⁻¹ and 1063 cm⁻¹. Aliphatic C–H deformation is present at 1158 cm⁻¹. The overall band pattern agrees with a hard‑segment aromatic polyurethane containing urethane, ester/ether, and alkyl moieties FTIR In-Depth Interpretation was not selected for this task, so this section shows the library-search result only and no deep AI interpretation was run.

Detailed interpretation

  • Top library match: (4-methyl-2-oxochromen-7-yl) hexadecanoate #11807
  • The carboxyl assignment at 1510 cm⁻¹ [6] is not a typical marker for polyurethane hard segments; it may reflect carboxylate end‑groups or an additive.
  • The low library match (15 %) and the absence of a specific polyurethane reference in the top‑hit list introduce uncertainty about the precise chemical identity.
  • The library search did not retrieve a high‑confidence polyurethane match; the proposed chemical class relies heavily on the direct literature evidence.
  • The 1510 cm⁻¹ band assignment remains ambiguous—it could be aromatic skeletal vibration rather than carboxyl.
  • Without additional reference spectra or complementary techniques, the exact composition (polyester‑urethane, polyether‑urethane, etc.) cannot be determined.

Recommended next steps: Acquire reference spectra of aromatic polyurethane elastomers or coatings for direct library comparison. Perform complementary analyses such as thermogravimetry (TGA) to detect urethane decomposition steps or NMR to identify specific monomers. If possible, synthesize a model polyurethane from a common aromatic diisocyanate and polyol to match the infrared fingerprint. Re‑run the FTIR search with a library focused on industrial polymers, particularly polyurethanes and polyesters.

Library Comparison

Library spectrum will appear here.

Library Search Results — Top 15 Candidates

Rank Match % Compound SMILES Spectrum No. Action
Loading library candidates...

Peak Analysis

★ = Literature-supported assignment
# Wavenumber (cm⁻¹) Absorbance Assignment Citation Assignment status
1 · 1158 1.00 - - -
2 · 1726 0.37 - - -
3 · 1248 0.32 - - -
4 · 1063 0.25 - - -
5 · 1604 0.16 - - -
6 · 1510 0.11 - - -

Appendix — Raw Spectrum

Raw sample spectrum
Generated by FTIR.fun — Report #20250915150840523821501
Discussion

Comments and follow-up evidence

Use this area to continue the interpretation, ask questions, or add extra verification evidence.

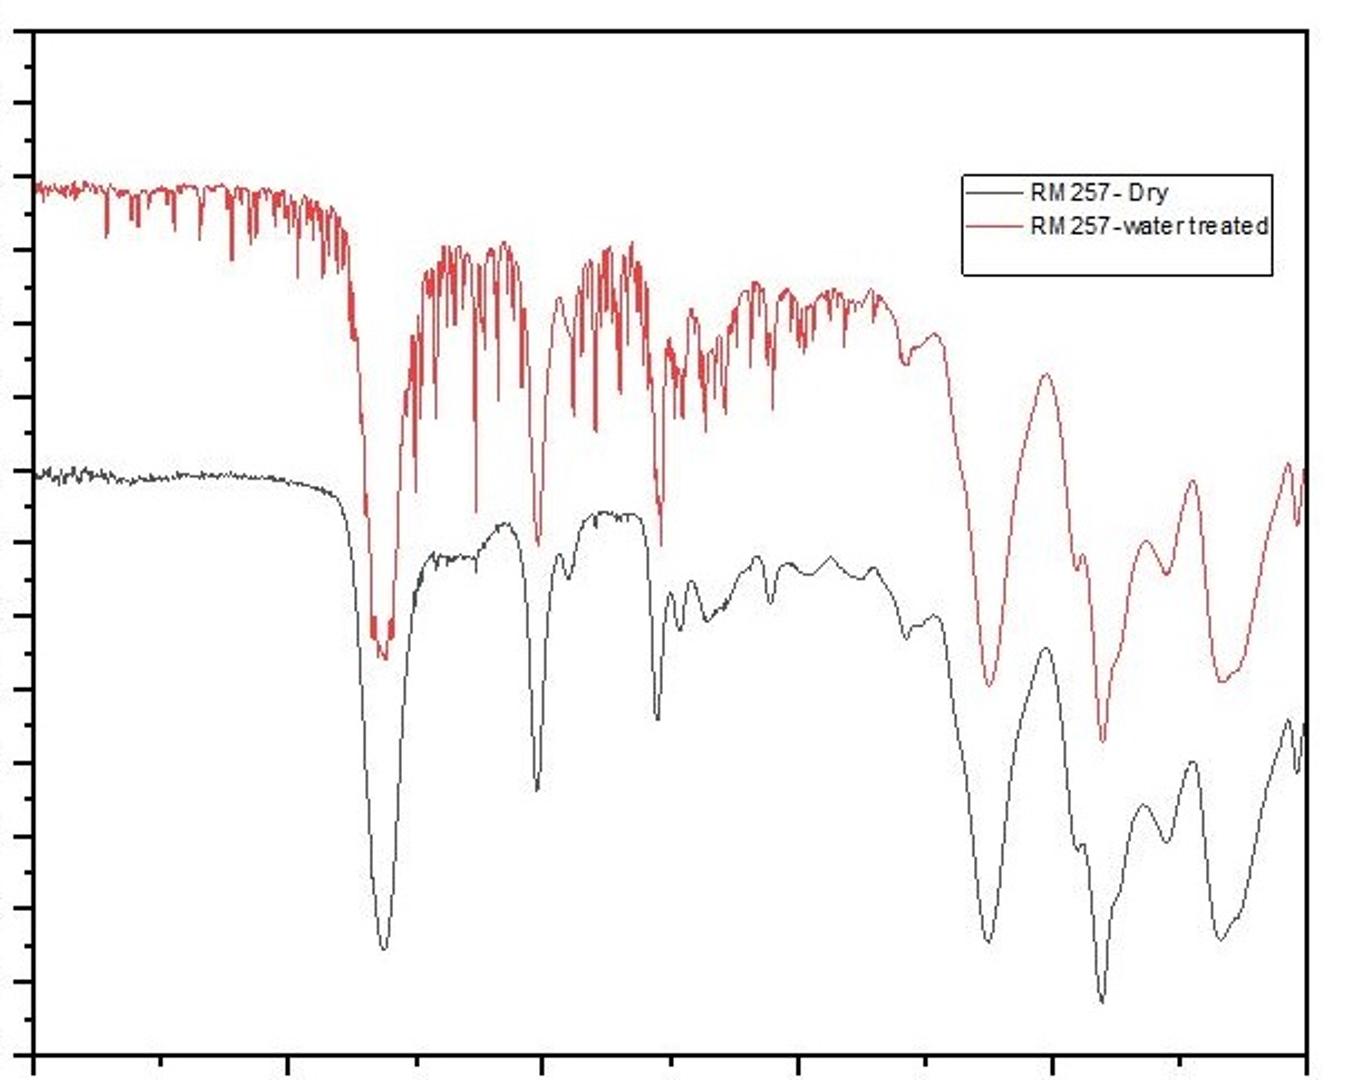
The above shows the FTIR analysis results of a JPG file uploaded by a user from Australia. The original image and extracted CSV file are displayed below.1.jpgtem.csv
en&2
Submit Requirement Form