PAGE DE RÉSULTATS

carbonyl-containing ester material, plausibly an acrylate- or polyester-type composition

Consultez le rapport ci-dessus. Utilisez les commentaires ci-dessous si vous avez besoin d'une discussion de suivi.

N° de résultat: 20250722000900659368613 Propriétaire: publicuser Commentaires: 1
  • Translating report into Français. English is shown for now.
FTIR ANALYSIS REPORT

FTIR Spectrum Analysis Report

No.: 20250722000900659368613 Date: 2025-07-23 02:14:16 Reported by: FTIR.fun Contact: [email protected]

Download a professional, formatted PDF of this analysis.

Top15

Similarity-ranked Top-15 library comparison

Choose matching result groups:
Library spectrum will appear here.
Library spectrum Interactive sample curve Move the pointer to show the vertical guide line.
Top 15 candidates

Reference library candidates

Rank Match % Compound Name Formula / SMILES Library preview Action
Reference candidates load with this Top-15 workbench.

Based on the library matches and evidence above.

Conclusion

carbonyl-containing ester material, plausibly an acrylate- or polyester-type composition

General assessment
-
#347 Initial rank 1 Current rank 1 Library lead match 0.0%
Conclusion
  1. 1719-1727 cm⁻¹ supports the presence of a carbonyl group in an ester-like region.
  2. 1113 cm⁻¹ is consistent with ester C-O stretching.
  3. 2844 cm⁻¹ is compatible with aliphatic hydrocarbon content.
Main limitation

The library confidence is low, with no meaningful separation among candidates.

Evidence & interpretation
Evidence

Key evidence

Correspondance principale de la bibliothèque
Poly(ethyl acrylate) #347 | match 0.0%
Direction du matériau
carbonyl-containing ester material, plausibly an acrylate- or polyester-type composition The spectrum is most consistent with a carbonyl-containing ester material, with the library placing Poly(ethyl acrylate) as the nearest named candidate. However, the overall match strength is very weak and there is no direct reference or related-literature support to justify a firm material assignment. The observed bands support a broad ester-containing organic composition, plausibly within an acrylate- or polyester-like direction, but the present evidence is not sufficient to confirm Poly(ethyl acrylate) specifically.
Support

Evidence supporting the conclusion

Only sample-relevant statements that support the present conclusion are shown here.

  1. The spectrum is most consistent with a carbonyl-containing ester material, with the library placing Poly(ethyl acrylate) as the nearest named candidate. However, the overall match strength is very weak and there is no direct reference or related-literature support to justify a firm material assignment. The observed bands support a broad ester-containing organic composition, plausibly within an acrylate- or polyester-like direction, but the present evidence is not sufficient to confirm Poly(ethyl acrylate) specifically.
  2. 1719-1727 cm⁻¹ supports the presence of a carbonyl group in an ester-like region.
  3. 1113 cm⁻¹ is consistent with ester C-O stretching.
  4. 2844 cm⁻¹ is compatible with aliphatic hydrocarbon content.
  5. The leading library names include Poly(ethyl acrylate), Poly(1,4-butylene adipate), acrylic polymer, and other ester-bearing compounds, indicating a recurring ester/carbonyl pattern.
  6. A strong band pair at 1719-1727 cm⁻¹ is characteristic of an ester-like carbonyl stretching region.
  7. The band at 1113 cm⁻¹ supports C-O stretching expected in ester-containing materials.
  8. Bands at 2844 and 2740 cm⁻¹ indicate aliphatic C-H stretching, consistent with an organic ester framework.
  9. The Top-15 library pattern is dominated by ester, carbonyl, acrylate-polymer, and polyester entries, which broadly supports an ester-rich material direction.
  10. Although Poly(ethyl acrylate) is the top library name, all listed similarities are effectively non-discriminating, S-O the retrieval does not securely distinguish that polymer from other ester-containing candidates.
Limitations

Evidence that limits the conclusion

  • The library confidence is low, with no meaningful separation among candidates.
  • No related-literature match was recovered to support a specific polymer or small-molecule identity.
  • The limited peak set does not provide distinctive bands needed to securely identify Poly(ethyl acrylate) over other ester-containing materials.
  • It remains unclear whether the sample is specifically Poly(ethyl acrylate), another acrylic polymer, a polyester, or a lower-molecular-weight ester-containing substance.
  • The feature at 2740 cm⁻¹ is not by itself sufficient to define a unique structure in the absence of stronger corroborating bands.
  • Additional characteristic fingerprint-region information would be needed to separate acrylate polymers from other ester-rich materials.
Recommendation

Suggested next verification

  • Recollect or inspect the full FTIR spectrum, especially the 1500-600 cm⁻¹ fingerprint region, to verify ester C-O-C band patterning and look for polymer-specific backbone features.
  • Compare the sample directly against authenticated spectra of Poly(ethyl acrylate), a generic acrylic polymer, and representative aliphatic polyesters such as poly(butylene adipate).
  • If the sample is a coating, adhesive, or extractable residue, run complementary analysis such as ATR-FTIR repeat measurement, DSC, or Py-GC/MS to distinguish an acrylate polymer from a polyester or small-molecule ester.
  • Check for repeatable carbonyl peak shape and position across replicate measurements, since ester subclass assignment often depends on the detailed carbonyl and C-O band profile.
Peak analysis

Detected peaks and interpretation

★ = Literature-supported peak assignment.

Index Characteristic Wavenumber Absorbance Evidence One-line interpretation Citation Confidence
1 · 1727 1.00 - - - -
2 · 1719 0.70 - - - -
3 · 1350 0.27 - - - -
4 · 1113 0.22 - - - -
5 · 1427 0.20 - - - -
6 · 2844 0.16 - - - -
7 · 2740 0.15 - - - -
Appendix

Sample information and raw spectrum

Original uploaded spectrum for reference and verification.

Baseline correction method: Asymmetric Least Squares Smoothing

The wavelength range for analysis(cm-1): [(650, 4000)]

Raw spectrum without baseline correction or other processing:

Sample spectrum image
Discussion

Commentaires et preuves de suivi

Utilisez cette zone pour poursuivre l'interprétation, poser des questions ou ajouter des preuves de vérification supplémentaires.

The above shows the FTIR analysis results of a doc file uploaded by a user from CANADA. The original image and extracted CSV file are displayed below.
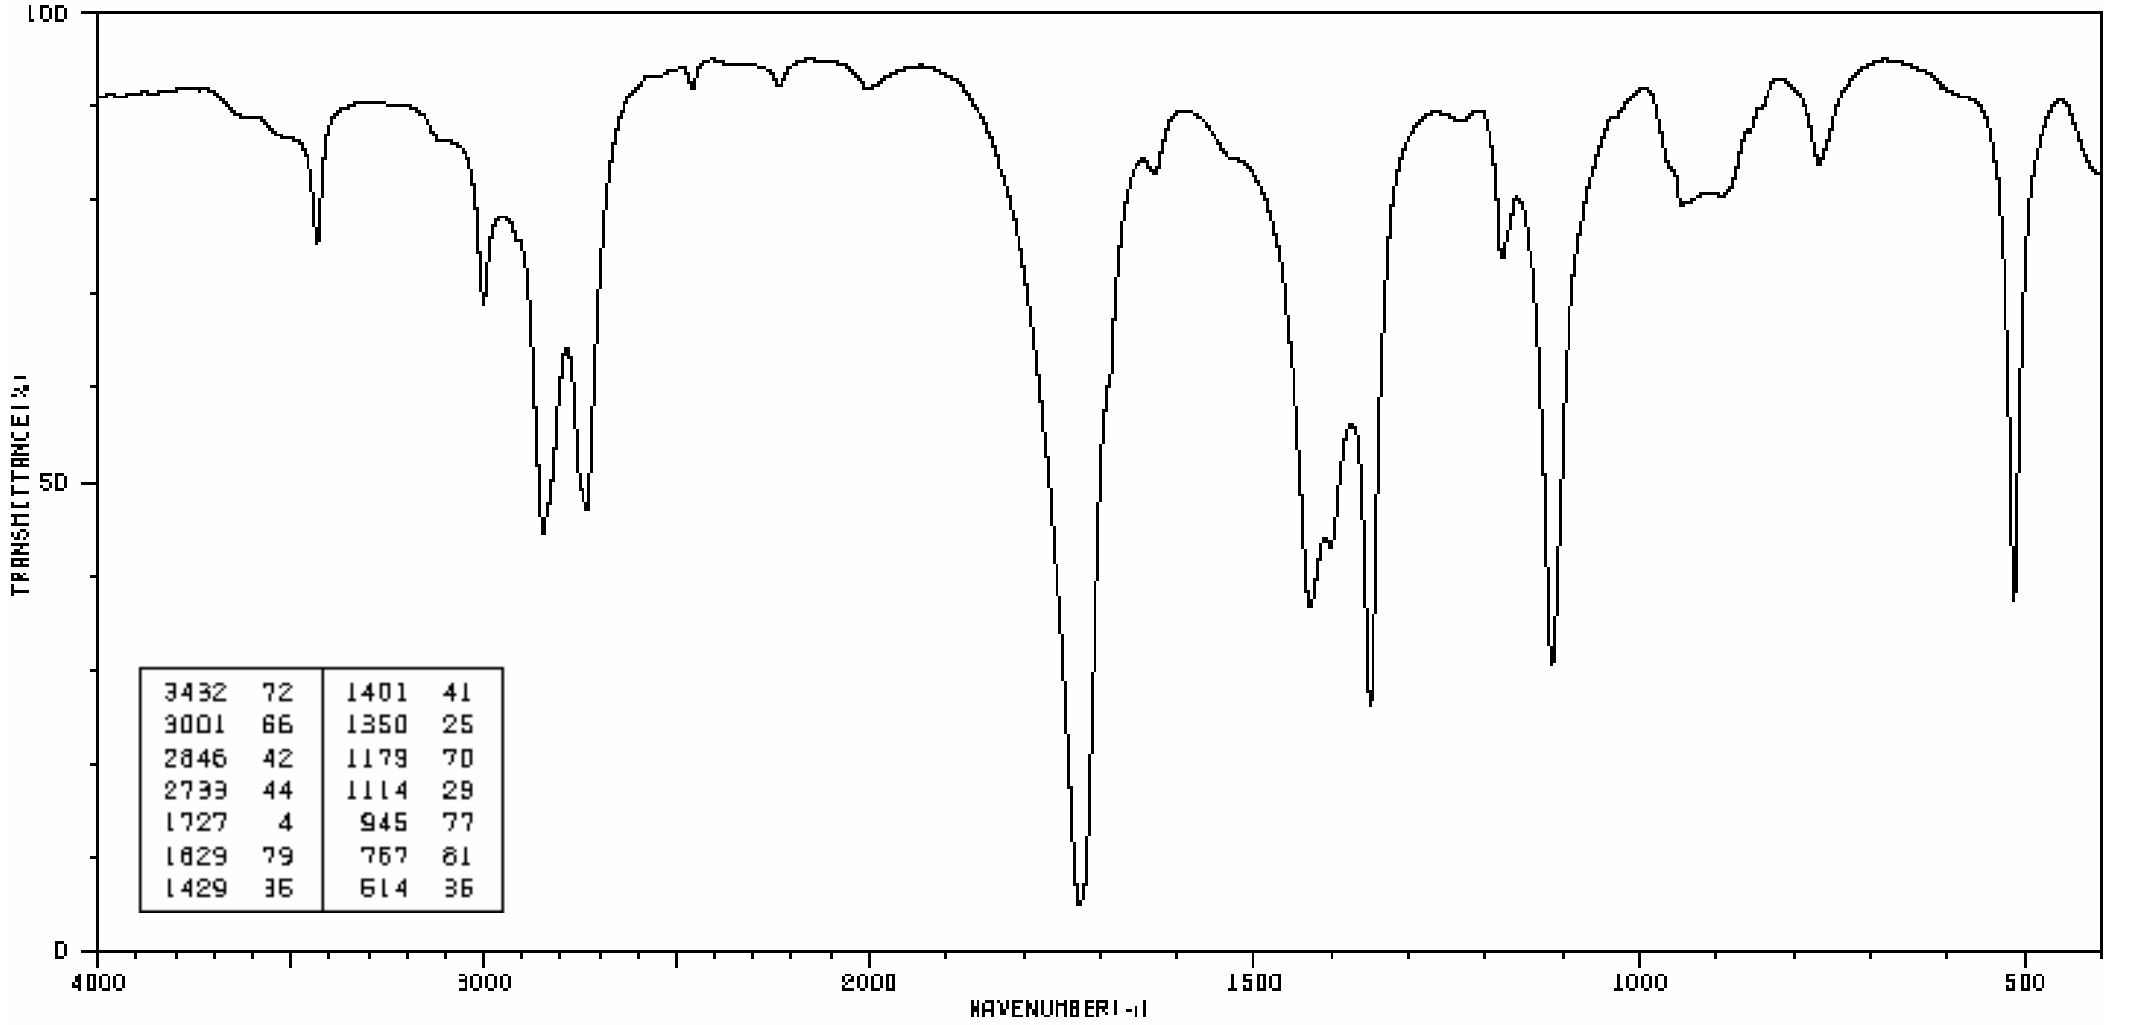
20250723091131.pngtem.csv

en&2
Soumettre la demande Formulaire