
PAGINA DE REZULTATE
Results20250423235425107656881-3 docx Taiwan
Vizualizați raportul de mai sus. Utilizați comentariile de mai jos dacă aveți nevoie de o discuție ulterioară.
Raport de analiză FTIR
Raport de analiză spectrală FTIR
Direcția materialului: -
Parametrii Probei și Măsurătorii
Raport Nr.
20250423235425107656881-3
Dată
2025-04-28 01:43:19
Interval spectral (cm⁻¹)
The default is the full wavelength range in this mode
Linia de bază
Corectare linie de bază AsLS
Rezultatul identificării
Doar căutare în bibliotecă — nu s-a selectat interpretare AI pentru această analiză.
Interpretare detaliată
- Cea mai bună potrivire din bibliotecă: Polypropylene+poly(ethylene:propylene) #25432
- Cea mai apropiată potrivire din bibliotecă: Polypropylene+poly(ethylene:propylene).
- Clasamentul bibliotecii menține acest candidat în top datorită similarității spectrale.
Comparație bibliotecă
Spectrul bibliotecii va apărea aici.
Rezultatele căutării în bibliotecă — Top 15 Candidați
| Rang | Potrivire % | Compus | SMILES | Nr. spectru | Acțiune |
|---|---|---|---|---|---|
| Se încarcă candidații din bibliotecă... | |||||
Analiza vârfurilor
★ = Atribuire susținută de literaturăAnexă — Spectru brut

Discuție
Comentarii și dovezi ulterioare
Utilizați această zonă pentru a continua interpretarea, a pune întrebări sau a adăuga dovezi suplimentare de verificare.
The user from Taiwan (IP: 2407::) uploaded a DOCX file containing three IR spectra. Swipe up to view the qualitative analysis of the third spectrum. The user also expressed intent to calculate sample thickness using interference peaks. Based on the spectra, the analysis was performed at wave numbers 3150 and 3290, yielding an interference peak difference (V₁ - V₂) of 140 cm-1 and ΔN = 1. By inputting the film's refractive index(n), the sample thickness (d) was determined.Here is the original spectrum of the sample extracted from the DOCX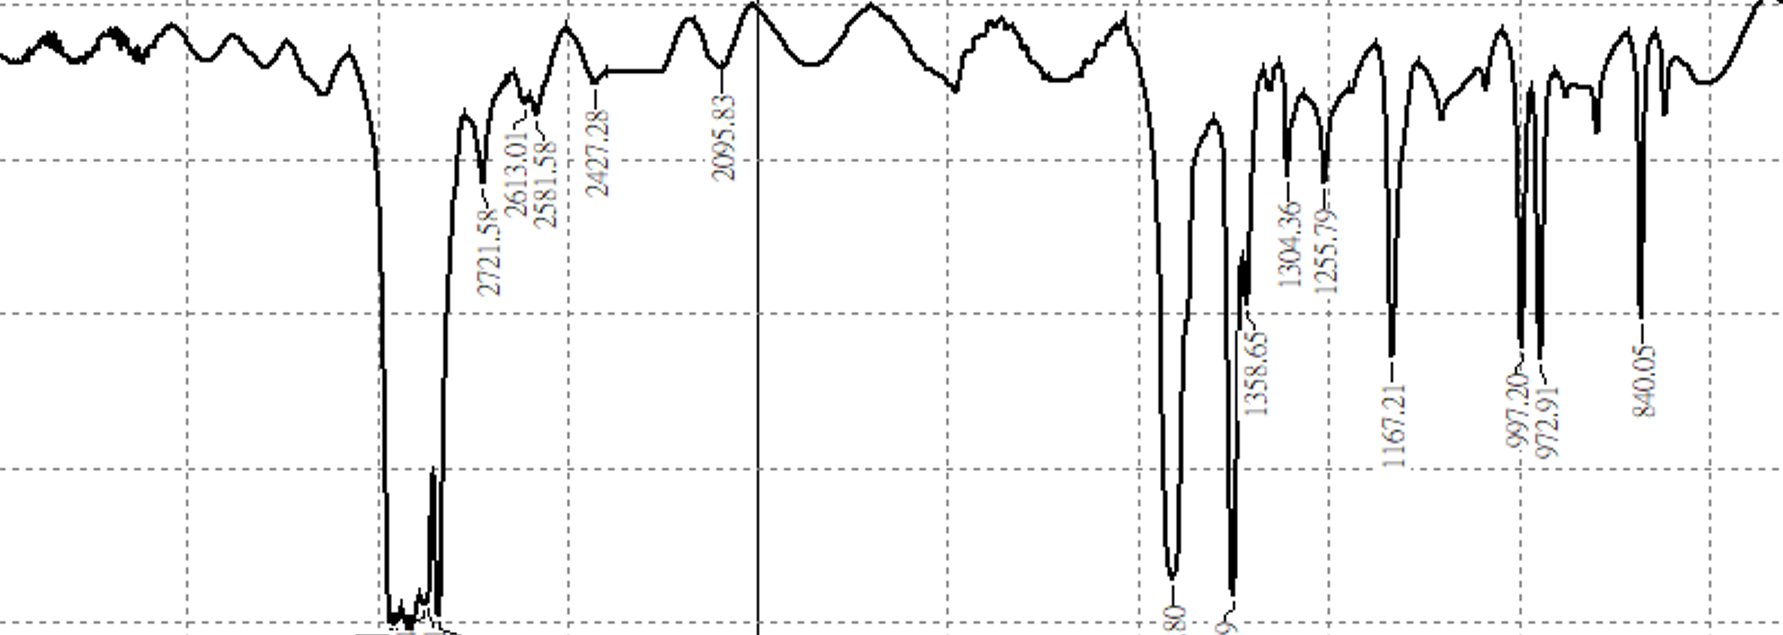
en&2