
STRONA WYNIKU
Results20250423235425107656881-3 docx Taiwan
Zobacz raport powyżej. Użyj komentarzy poniżej, jeśli potrzebujesz dalszej dyskusji.
Raport analizy FTIR
Raport analizy widma FTIR
Kierunek materiałowy: -
Parametry próbki i pomiaru
Raport nr
20250423235425107656881-3
Data
2025-04-28 01:43:19
Zakres spektralny (cm⁻¹)
The default is the full wavelength range in this mode
Linia bazowa
Korekta linii bazowej AsLS
Wynik identyfikacji
Tylko wyszukiwanie w bibliotece — nie wybrano interpretacji AI dla tej analizy.
Szczegółowa interpretacja
- Najlepsze dopasowanie biblioteki: Polipropylen+ poli(etylen:propylen) #25432
- Najbliższe dopasowanie w bibliotece: Polipropylen+ poli(etylen:propylen).
- Ranking biblioteki utrzymuje tego kandydata na szczycie ze względu na podobieństwo widmowe.
Porównanie bibliotek
Widmo biblioteki pojawi się tutaj.
Wyniki wyszukiwania w bibliotece — 15 najlepszych kandydatów
| Ranga | Dopasowanie % | Związek | SMILES | Nr widma | Akcja |
|---|---|---|---|---|---|
| Ładowanie kandydatów biblioteki... | |||||
Analiza pików
★ = Przypisanie poparte literaturąZałącznik — Spektrum surowe

Dyskusja
Komentarze i dowody uzupełniające
Użyj tego obszaru, aby kontynuować interpretację, zadawać pytania lub dodać dodatkowe dowody weryfikacyjne.
The user from Taiwan (IP: 2407::) uploaded a DOCX file containing three IR spectra. Swipe up to view the qualitative analysis of the third spectrum. The user also expressed intent to calculate sample thickness using interference peaks. Based on the spectra, the analysis was performed at wave numbers 3150 and 3290, yielding an interference peak difference (V₁ - V₂) of 140 cm-1 and ΔN = 1. By inputting the film's refractive index(n), the sample thickness (d) was determined.Here is the original spectrum of the sample extracted from the DOCX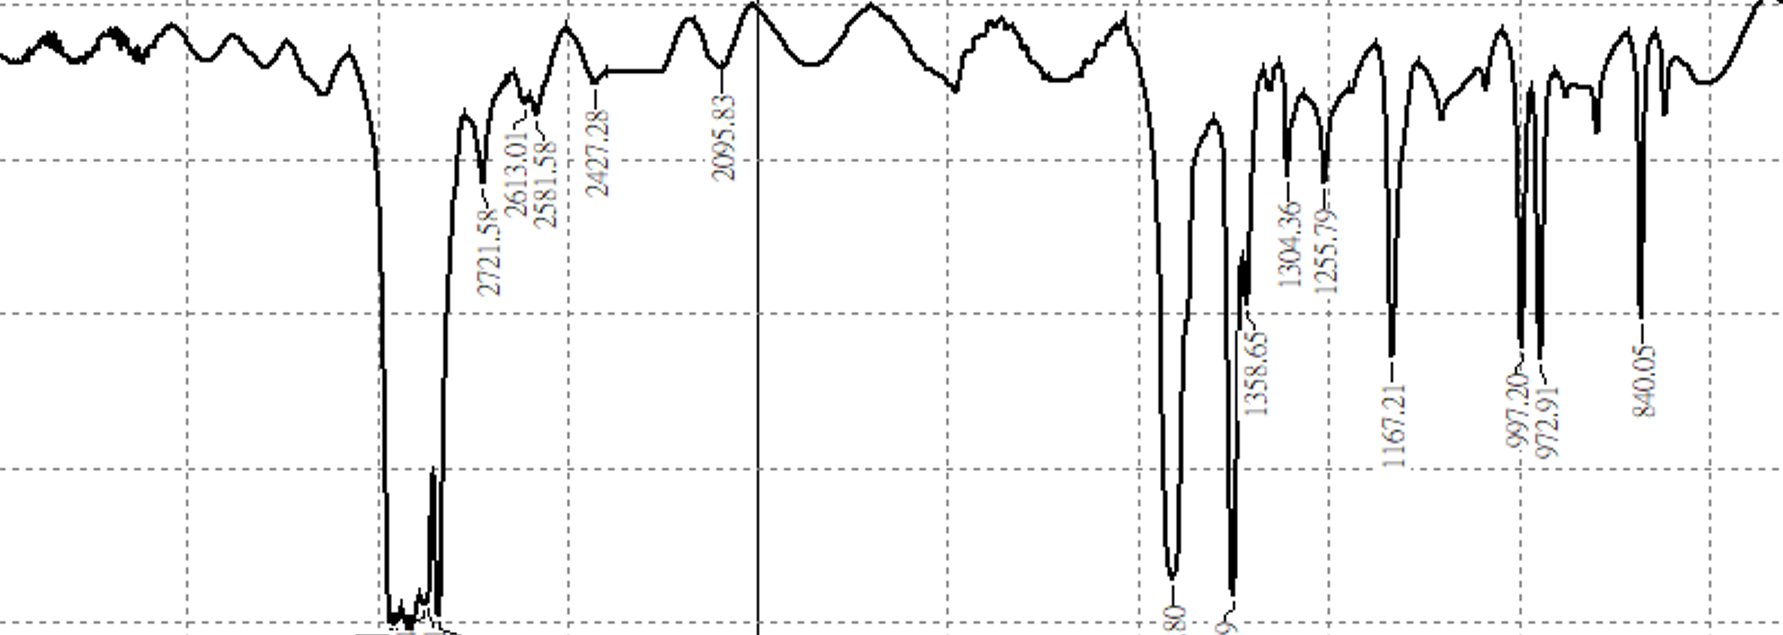
en&2