
НАТЫЙЖА БЕТ
Results20250423235425107656881-3 docx Taiwan
Жогорудагы баяндаманы көрүңүз. Кийинки талкуу керек болсо, төмөндөгү комментарийлерди колдонуңуз.
FTIR талдоо отчету
FTIR спектр анализи отчету
Материалдын багыты: -
Үлгү жана өлчөө параметрлери
Отчет №
20250423235425107656881-3
Дата
2025-04-28 01:43:19
Спектрдик диапазон (cm⁻¹)
The default is the full wavelength range in this mode
Базалык сызык
AsLS базалык сызыгын оңдоо
Иденттештирүү натыйжасы
Китепкана издөө гана — бул анализ үчүн AI чечмелөө тандалган эмес.
Чоо-жайын чечмелөө
- Эң жакшы китепкана дал келүүсү: Polypropylene+poly(ethylene:propylene) #25432
- Эң жакын китепкана дал келүү: Polypropylene+poly(ethylene:propylene).
- Китепкананын рейтинги бул талапкерди спектрдик окшоштук боюнча биринчи орунда кармап турат.
Китепкана салыштыруу
Китепкана спектри ушул жерде пайда болот.
Китепкана издөө жыйынтыктары — мыкты 15 талапкер
| Рейтинг | Дал келүү % | Кошмо | SMILES | Спектр № | Аракет |
|---|---|---|---|---|---|
| Китепкана талапкерлери жүктөлүүдө... | |||||
Чокуларды талдоо
★ = Адабият менен тастыкталган дайындооКошумча — Чийки спектр

Талкуу
Комментарийлер жана кошумча далилдер
Бул аймакты интерпретацияны улантуу, суроо берүү же кошумча текшерүү далилдерин кошуу үчүн колдонуңуз.
The user from Taiwan (IP: 2407::) uploaded a DOCX file containing three IR spectra. Swipe up to view the qualitative analysis of the third spectrum. The user also expressed intent to calculate sample thickness using interference peaks. Based on the spectra, the analysis was performed at wave numbers 3150 and 3290, yielding an interference peak difference (V₁ - V₂) of 140 cm-1 and ΔN = 1. By inputting the film's refractive index(n), the sample thickness (d) was determined.Here is the original spectrum of the sample extracted from the DOCX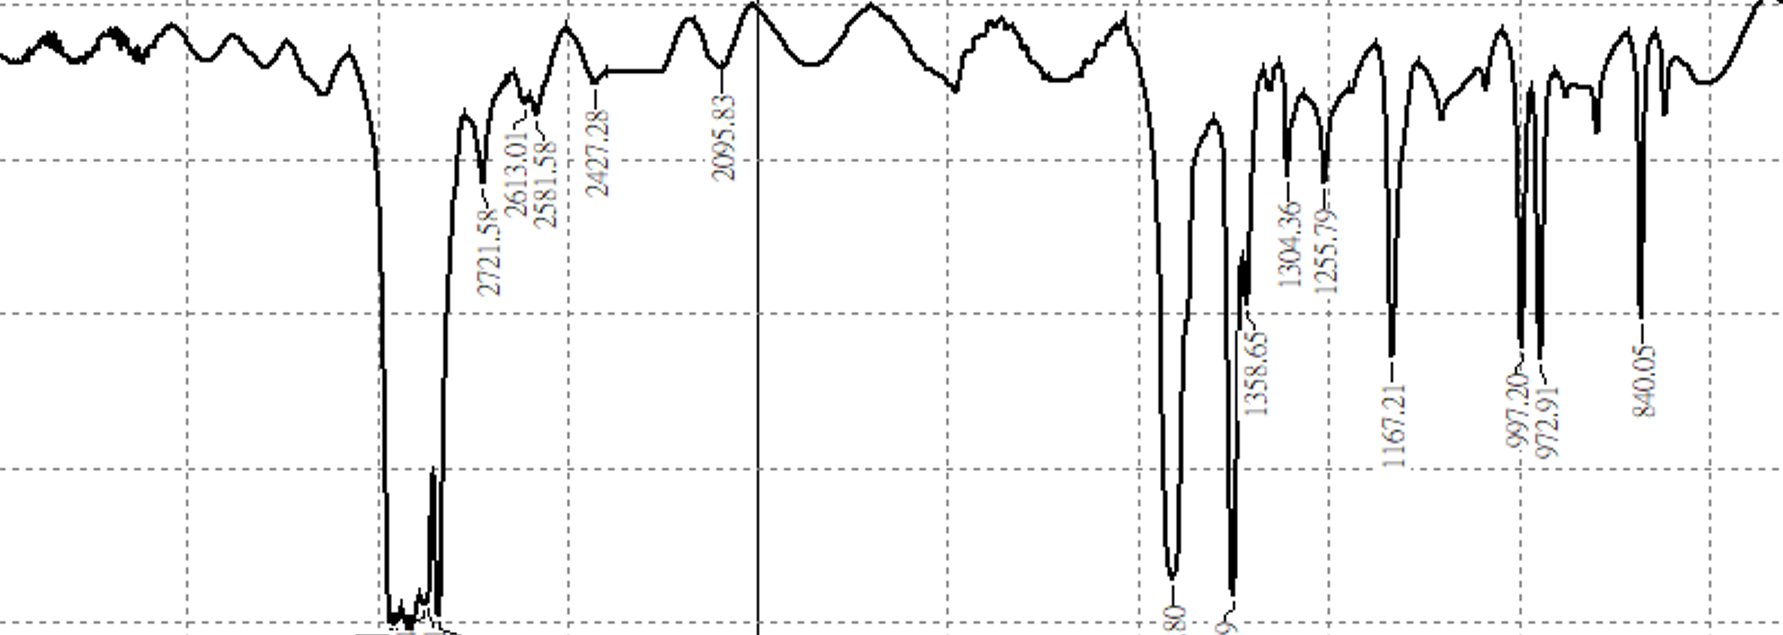
en&2