
結果ページ

Results20250423235425107656881-3 docx Taiwan

上記のレポートをご覧ください。フォローアップの議論が必要な場合は、以下のコメントをご利用ください。

結果番号: 20250423235425107656881-3 所有者: publicuser コメント: 1
  • Translating report into 日本語. English is shown for now.
FTIR ANALYSIS REPORT

FTIR Spectrum Analysis Report

No.: 20250423235425107656881-3 Date: 2025-04-28 01:43:19 Reported by: FTIR.fun Contact: [email protected]

Download a professional, formatted PDF of this analysis.

Top15

Top-1 library candidate vs. uploaded sample

Library spectrum will appear here.
Library spectrum Interactive sample curve Move the pointer to show the vertical guide line.
Top 15 candidates

Reference library candidates

Rank Match % Compound Name Formula / SMILES Library preview Action
Reference candidates load with this Top-15 workbench.

Based on the library matches and evidence above.

Conclusion

-

-
Evidence & interpretation
Evidence

Key evidence

ライブラリリードマッチ
Polypropylene+poly(ethylene:propylene) #25432
Support

Evidence supporting the conclusion

Only sample-relevant statements that support the present conclusion are shown here.

  1. 最も近いライブラリ一致: Polypropylene+poly(ethylene:propylene).
  2. ライブラリランキングは、この候補をスペクトル類似性でトップに保ちます。.
Limitations

Evidence that limits the conclusion

No limiting evidence was recorded.

Recommendation

Suggested next verification

No verification steps were suggested.

Peak analysis

Detected peaks and interpretation

★ = Literature-supported peak assignment.

Index Characteristic Wavenumber Absorbance Evidence One-line interpretation Citation Confidence
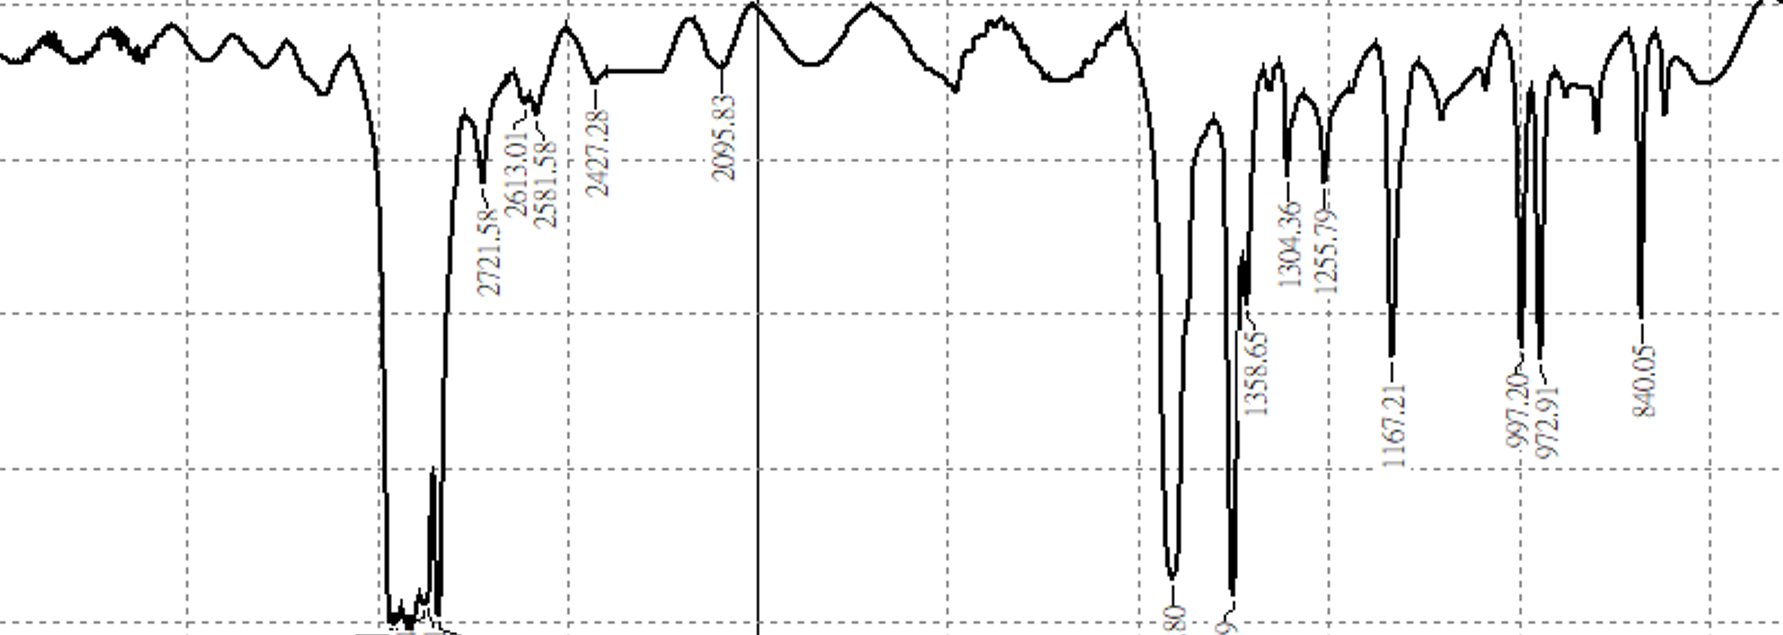
1 · 2912 1.00 - - - -
2 · 2958 0.73 - - - -
3 · 2843 0.54 - - - -
4 · 2879 0.46 - - - -
5 · 1455 0.37 - - - -
6 · 1375 0.32 - - - -
7 · 1164 0.11 - - - -
8 · 970 0.11 - - - -
Appendix

Sample information and raw spectrum

Original uploaded spectrum for reference and verification.

Baseline correction method: Asymmetric Least Squares Smoothing

The wavelength range for analysis(cm-1): The default is the full wavelength range in this mode

Raw spectrum without baseline correction or other processing:

Sample spectrum image
議論

コメントとフォローアップ証拠

このエリアを使用して、解釈を続けたり、質問したり、追加の検証証拠を追加したりしてください。

The user from Taiwan (IP: 2407::) uploaded a DOCX file containing three IR spectra. Swipe up to view the qualitative analysis of the third spectrum. The user also expressed intent to calculate sample thickness using interference peaks. Based on the spectra, the analysis was performed at wave numbers 3150 and 3290, yielding an interference peak difference (V₁ - V₂) of 140 cm-1 and ΔN = 1. By inputting the film's refractive index(n), the sample thickness (d) was determined.Here is the original spectrum of the sample extracted from the DOCX3.png
en&2
リクエストを送信 フォーム