RESULT PAGE

oxygenated organic material with C–O bonding and multiple O–H/N–H-type bands

View the report above. Use the comments below if you need follow-up discussion.

Result No.: 20250423073556113571366 Owner: publicuser Comments: 1
FTIR Analysis Report

oxygenated organic material with C–O bonding and multiple O–H/N–H-type bands

Sample & Measurement Parameters

Report No. 20250423073556113571366
Date 2025-04-23 01:55:42
Spectral Range (cm⁻¹) [(650, 4000)]
Baseline AsLS baseline correction
Library match 0%

Identification Result

0%

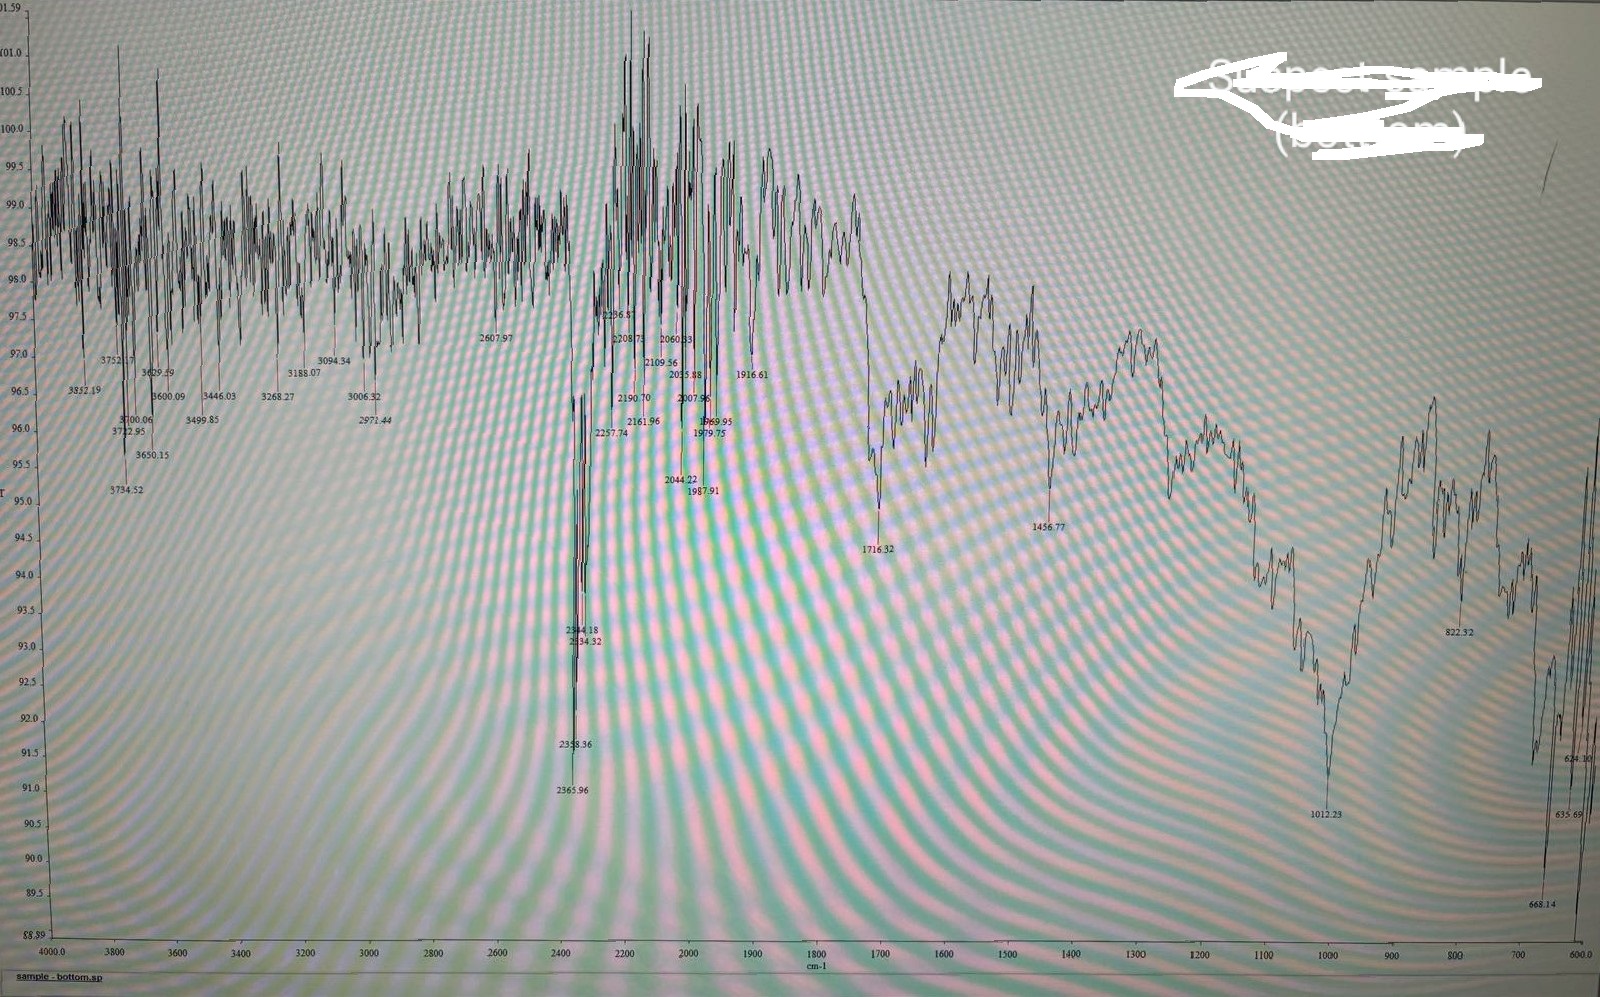
The library’s nearest named match is Poly(vinyl formal), but the match quality is effectively non-discriminating and is not supported by direct reference or related-literature evidence. The sample instead supports only a broader oxygenated organic material direction. Bands near 1017, 1058, and 1105 cm⁻¹ are consistent with C–O stretching, while the cluster of high-wavenumber bands from 3283 to 3808 cm⁻¹ indicates substantial O–H and/or N–H-type absorption. Weak aliphatic C–H stretching is present near 2963 and 2999 cm⁻¹. This evidence is too nonspecific to justify a firm assignment to Poly(vinyl formal) or to the nitrogen-heterocycle pattern suggested by the noisy top-15 library spread

Detailed interpretation

  • Top library match: Poly(vinyl formal) #7118
  • All listed library candidates have 0.000 similarity, S-O the retrieval does not provide a reliable specific identification.
  • Related-literature evidence is unavailable and does not narrow the assignment.
  • The top-15 library pattern is chemically inconsistent, mixing polymeric, chlorinated, phosphorus-sulfur, hydrocarbon, and silicate-like candidates, S-O its consensus is not trustworthy for a narrow conclusion.
  • The proposed nitrogen-heterocycle direction is not convincingly supported by the observed peak set.
  • It remains unclear whether the broad high-wavenumber absorption is dominated by O–H, N–H, water, or a mixture of these contributions.
  • The 1633–1706 cm⁻¹ region is not sufficiently resolved to determine whether a true carbonyl-containing component is present.
  • The current evidence cannot distinguish between an oxygenated polymer, resin, additive-containing organic film, or a mixed/contaminated sample.

Recommended next steps: Recollect the FTIR spectrum after improved background subtraction and atmospheric compensation, especially to reduce interference in the 2171–2406 cm⁻¹ region. Inspect the 3200–3800 cm⁻¹ and 1600–1750 cm⁻¹ regions with higher signal-to-noise and full-spectrum review to separate hydroxyl, amine, water, and possible carbonyl contributions. If this is a polymer or coating sample, compare against authenticated spectra of Poly(vinyl formal) and other oxygenated polymers using full-spectrum overlay rather than library rank alone. Acquire complementary data such as Raman spectroscopy, DSC, or pyrolysis-GC/MS if a specific polymer or formulation identity is required.

Library Comparison

Match group:
Library spectrum will appear here.

Library Search Results — Top 15 Candidates

Rank Match % Compound SMILES Spectrum No. Action
Loading library candidates...

Peak Analysis

★ = Literature-supported assignment
# Wavenumber (cm⁻¹) Absorbance Assignment Citation Assignment status
1 · 1017 1.00 - - -
2 · 695 0.68 - - -
3 · 665 0.64 - - -
4 · 680 0.58 - - -
5 · 2338 0.44 - - -
6 · 1058 0.40 - - -
7 · 2305 0.38 - - -
8 · 822 0.34 - - -
9 · 2393 0.33 - - -
10 · 751 0.32 - - -
11 · 708 0.31 - - -
12 · 1105 0.31 - - -
13 · 737 0.31 - - -
14 · 2321 0.31 - - -
15 · 954 0.31 - - -
16 · 803 0.30 - - -
17 · 2358 0.29 - - -
18 · 842 0.27 - - -
19 · 767 0.25 - - -
20 · 927 0.24 - - -
21 · 2376 0.23 - - -
22 · 1706 0.23 - - -
23 · 860 0.22 - - -
24 · 2274 0.21 - - -
25 · 795 0.21 - - -
26 · 1445 0.21 - - -
27 · 908 0.21 - - -
28 · 1693 0.20 - - -
29 · 1263 0.20 - - -
30 · 2384 0.20 - - -
31 · 1423 0.20 - - -
32 · 2288 0.19 - - -
33 · 1682 0.19 - - -
34 · 1633 0.17 - - -
35 · 1459 0.17 - - -
36 · 1408 0.17 - - -
37 · 2368 0.15 - - -
38 · 1965 0.14 - - -
39 · 1503 0.14 - - -
40 · 3712 0.14 - - -
41 · 1989 0.14 - - -
42 · 2247 0.13 - - -
43 · 2963 0.13 - - -
44 · 2406 0.13 - - -
45 · 1955 0.13 - - -
46 · 1947 0.13 - - -
47 · 2000 0.12 - - -
48 · 3808 0.12 - - -
49 · 3680 0.11 - - -
50 · 2999 0.11 - - -
51 · 3525 0.11 - - -
52 · 3773 0.11 - - -
53 · 3283 0.11 - - -
54 · 1981 0.11 - - -
55 · 3499 0.11 - - -
56 · 2171 0.10 - - -
57 · 1896 0.10 - - -
58 · 3628 0.10 - - -
59 · 3788 0.10 - - -
60 · 3467 0.10 - - -
61 · 2227 0.10 - - -
62 · 3659 0.10 - - -

Appendix — Raw Spectrum

Raw sample spectrum
Generated by FTIR.fun — Report #20250423073556113571366 2025-04-23 01:55:42
Discussion

Comments and follow-up evidence

Use this area to continue the interpretation, ask questions, or add extra verification evidence.

This is the FTIR analysis result of a JPG file uploaded by a user with IP 2a02:: The original image is shown below.20250423073556113571366 - 副本.jpg
en&2
Submit Requirement Form