
fluorinated material with strong bands in the C–F stretching region
Tazama ripoti hapo juu. Tumia maoni hapa chini ikiwa unahitaji mjadala wa ufuatiliaji.
fluorinated material with strong bands in the C–F stretching region
Vigezo vya Sampuli na Kipimo
Matokeo ya Utambulisho
0%Ushahidi wa sasa wa FTIR hauungi mkono utambulisho thabiti wa kiwango cha kiwanja. Sampuli inaonyesha mikanda miwili tu iliyoripotiwa, katika 1214 na 1155 cm⁻¹, ambayo inaendana na ufyonzaji mkubwa unaopatikana katika nyenzo za florini katika eneo la kunyoosha C–F. Ingawa hit la karibu zaidi la maktaba ni 2,2,3,3,3-pentafluoropropan-1-ol, ujasiri wa kurejesha haupo kikamilifu na hakuna ushahidi wa moja kwa moja au wa fasihi unaounga mkono dutu hiyo mahususi. Kwa hivyo, mgawo mpana kwa nyenzo zenye florini ndio hitimisho linaloungwa mkono zaidi na kemia kutoka kwa wigo unaopatikana
Tafsiri ya kina
- Mechi bora ya maktaba: 2,2,3,3,3-pentafluoropropan-1-ol #63873 | match 0.0%
- Mikanda katika 1214 na 1155 cm⁻¹ inasaidia nyenzo za kikaboni zenye florini kwa sababu eneo hili kwa kawaida lina ufyonzaji wenye nguvu wa kunyoosha C–F.
- Wagombea wengi wakuu wa maktaba wana florini, ikiwemo 2,2,3,3,3-pentafluoropropan-1-ol, ingizo la resini ya floropovimer, 1,1,1,3,3,3-hexafluoropropane-2,2-diamine, 2-(2-fluorophenyl)ethanol, na bromo-trifluoromethane.
- Jina la karibu zaidi la maktaba ni 2,2,3,3,3-pentafluoropropan-1-ol, ambalo kwa kiwango cha chini linaendana kikemia na ufyonzaji wenye nguvu katika eneo la kunyoosha florini.
- Muonekano unaozingatiwa umepunguzwa kwa mikanda katika 1214 na 1155 cm⁻¹.
- Ufyonzaji huu unaangukia katika eneo ambalo kwa kawaida linahusishwa na sifa za kunyoosha C–F zenye nguvu katika nyenzo za kikaboni zenye florini.
- Matokeo bora ya maktaba ni 2,2,3,3,3-pentafluoropropan-1-ol, lakini ufanano wote ulioripotiwa wa maktaba ni 0.000, kwa hivyo mechi haina nguvu ya kutosha kwa utambulisho maalum.
- Mchoro wa maktaba ya Top-15 unajumuisha wagombea kadhaa wenye florini na halojeni, ambayo inasaidia tafsiri pana ya vyenye halojeni, na kemia ya florini ikiwa ni seti ndogo inayolingana zaidi kutokana na nafasi za kilele na uwepo wa wagombea wenye florini.
- Nakala ya makubaliano ya maktaba pia inataja utendaji mwingine, lakini sampuli haina mikanda ya ziada iliyoripotiwa inayohitajika kuendelea mgawo mwembamba unaohusisha O–H, N–H, S=O, au muundo wa kunukia.
- Ujasiri wa maktaba ni mdogo, na ufanano wote ulioorodheshwa umeripotiwa kama 0.000, kwa hivyo hit bora haiwezi kuchukuliwa kama utambulisho wa kuaminika.
- Orodha ya kilele inayopatikana haionyeshi mikanda ya ziada ya tabia ambayo ingetarajiwa kusaidia mgawanyo mwembamba kama vile kunyoosha O–H kwa pombe, mikanda ya N–H kwa amini, au mikanda inayohusiana na pete kwa kiwanja cha kunukia.
- Wigo uliopo ni mwembamba sana kutofautisha kati ya molekuli ndogo zenye florini, vitu vya kunukia vyenye florini, au nyenzo za polima zenye florini.
- Kwa sababu mikanda miwili tu ya kati-IR imeripotiwa, bado haijulikani ikiwa sampuli ina sifa za ziada ambazo hazijaripotiwa nje ya eneo hili jembamba.
- Jina maalum la hit bora, 2,2,3,3,3-pentafluoropropan-1-ol, linabaki kuwa pendekezo dhaifu la maktaba badala ya utambulisho unaoungwa mkono.
Ulinganisho wa Maktaba
Matokeo ya Utafutaji wa Maktaba — Watahiniwa 15 Bora
| Cheo | Linganisha % | Kiwanja | SMILES | Nambari ya wigo | Kitendo |
|---|---|---|---|---|---|
| Inapakia wagombea wa maktaba... | |||||
Uchambuzi wa Kilele
★ = Kazi inayoungwa mkono na fasihiKiambatisho — Spectrum Ghafi

Maoni na ushahidi wa ufuatiliaji
Tumia eneo hili kuendelea na ufafanuzi, kuuliza maswali, au kuongeza ushahidi wa ziada wa uthibitishaji.
This is the search result for the file with the extension .tif uploaded by user 159:xx.xx.217 raw image: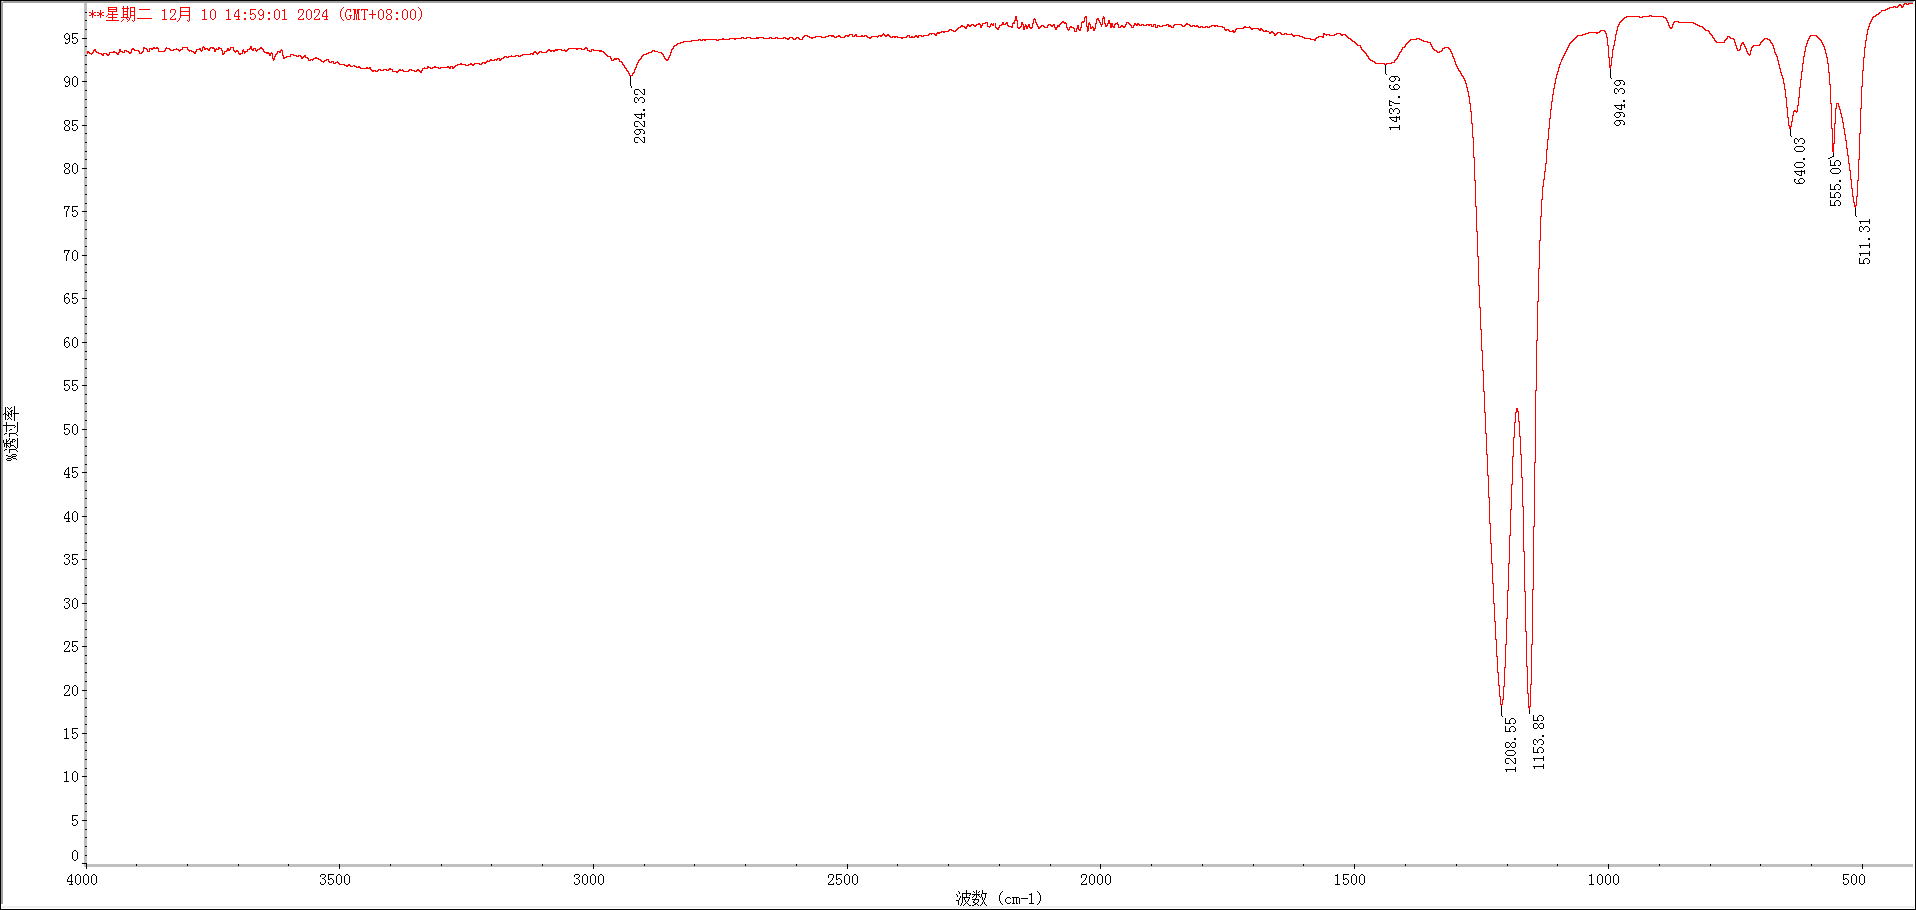
en&2