
Use it when the relevant paper contains a useful spectral figure but no downloadable numerical spectrum, and a visual side-by-side comparison is not precise enough.
LITERATURE & RESEARCH
Turn an FTIR figure in a paper into data you can compare with your experiment.
When a publication shows the useful spectrum only as an image, recover the curve as numerical data, review extraction quality, and compare it with your own FTIR spectrum. DOI, figure information, source image and review state remain attached so the literature curve does not lose its provenance.
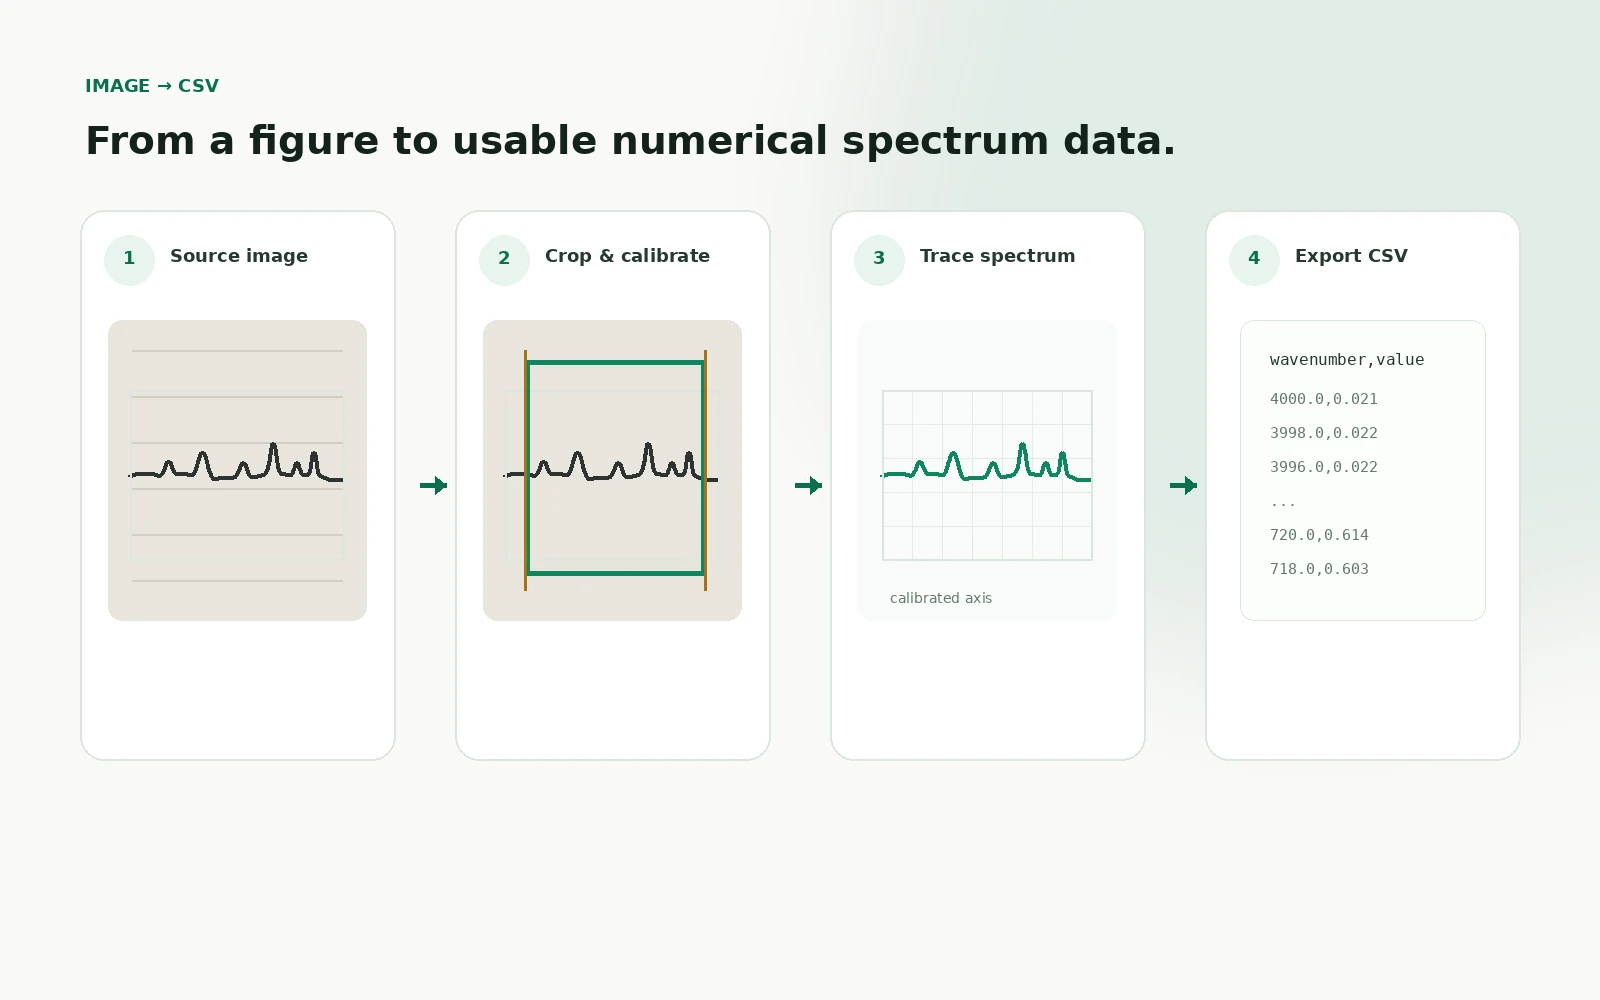
Recover the published trace, align the comparison range and review peak-position and intensity differences against your own experimental spectrum.
Researchers get numerical curves they can overlay and inspect; literature or knowledge platforms can attach machine-readable FTIR evidence to DOI- and figure-level records instead of storing only an image.
Quality principle:Ambiguous figures are not silently converted into certain data. Multi-curve selection, grid interference, legend overlap or uncertain axes can remain in REVIEW_REQUIRED until a reviewer resolves the extraction.
Published spectrum
Keep the curve tied to the publication.
- Figure or panel image
- DOI, title and figure label
- Curve selection when a figure contains multiple traces
- Source-image and extraction provenance
Your experiment
Compare against the spectrum you actually measured.
- Original instrument file where available
- Sample and experimental context
- Analysis range and preprocessing choices
- Overlay and structured peak differences
Quality gate
Review is a scientific state, not an error to hide.
Multi-curve figures, grid contamination, legend overlap or uncertain axes remain REVIEW_REQUIRED until a person resolves them. Once the recovered curve is accepted, deterministic comparison can report peak shifts, new or missing bands and intensity differences while retaining the extraction record.
DigitizeRevizuireComparăRetain provenance