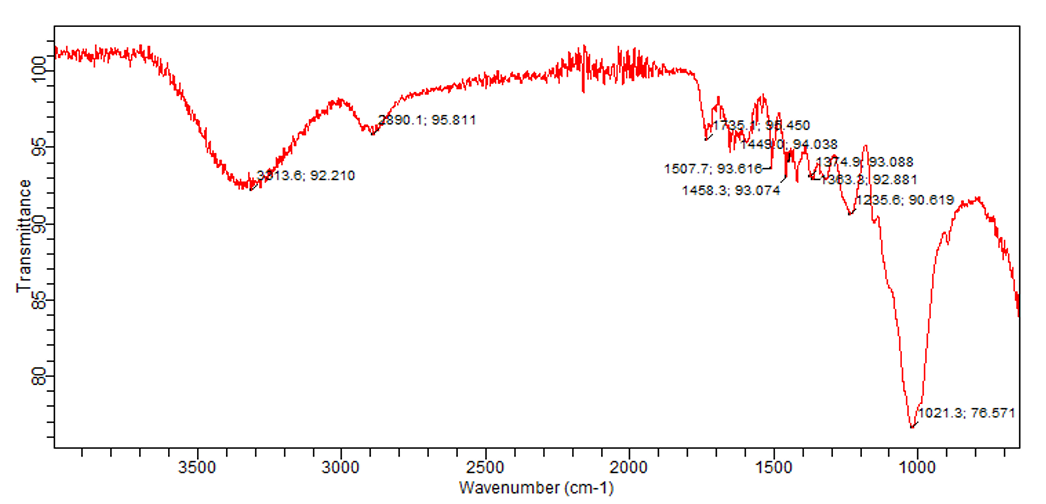
1. **Peak 797 cm⁻¹ (Weak, Sharp)** - **Wavenumber Assignment:** 797 cm⁻¹ - **Functional Group/Bond Vibration:** C-Cl stretching (alkyl halides) or out-of-plane C-H bending (aromatics). - **Justification:** Peaks around 800 cm⁻¹ are often associated with C-Cl stretching vibrations or aromatic C-H bending vibrations.
2. **Peak 953 cm⁻¹ (Weak, Sharp)** - **Wavenumber Assignment:** 953 cm⁻¹ - **Functional Group/Bond Vibration:** O-H bending (alcohols) or C-H bending (alkenes). - **Justification:** Peaks near 950 cm⁻¹ can indicate O-H bending vibrations in alcohols or C-H bending in alkenes.
3. **Peak 1099 cm⁻¹ (Strong, Broad)** - **Wavenumber Assignment:** 1099 cm⁻¹ - **Functional Group/Bond Vibration:** C-O stretching (alcohols, ethers, or esters). - **Justification:** Strong, broad peaks around 1100 cm⁻¹ are characteristic of C-O stretching vibrations in alcohols, ethers, or esters.
4. **Peak 1635 cm⁻¹ (Weak, Sharp)** - **Wavenumber Assignment:** 1635 cm⁻¹ - **Functional Group/Bond Vibration:** C=C stretching (alkenes) or C=O stretching (ketones, aldehydes). - **Justification:** Peaks near 1635 cm⁻¹ are often associated with C=C stretching in alkenes or C=O stretching in carbonyl compounds.
5. **Peak 3336 cm⁻¹ (Weak, Broad)** - **Wavenumber Assignment:** 3336 cm⁻¹ - **Functional Group/Bond Vibration:** O-H stretching (alcohols or phenols). - **Justification:** Broad peaks around 3300-3500 cm⁻¹ are characteristic of O-H stretching vibrations in alcohols or phenols.
**Conclusion:** The FTIR spectrum suggests the presence of an alcohol or phenol (O-H stretching at 3336 cm⁻¹, O-H bending at 953 cm⁻¹, and C-O stretching at 1099 cm⁻¹). The weak peak at 1635 cm⁻¹ may indicate an alkene (C=C) or a carbonyl group (C=O). The peak at 797 cm⁻¹ could suggest an aromatic compound or an alkyl halide. The compound likely belongs to the alcohol or phenol class, potentially with an aromatic or carbonyl substituent.
This discussion presents an infrared spectral analysis combining
automated interpretation with reference comparison to support
functional group identification and structural assessment.
FTIR Spectrum Interpretation Summary
Comparative Analysis Conclusion
AI-assisted Interpretation Conclusion
**FTIR Spectrum Analysis:**
1. **Peak 797 cm⁻¹ (Weak, Sharp)**
- **Wavenumber Assignment:** 797 cm⁻¹
- **Functional Group/Bond Vibration:** C-Cl stretching (alkyl halides) or out-of-plane C-H bending (aromatics).
- **Justification:** Peaks around 800 cm⁻¹ are often associated with C-Cl stretching vibrations or aromatic C-H bending vibrations.
2. **Peak 953 cm⁻¹ (Weak, Sharp)**
- **Wavenumber Assignment:** 953 cm⁻¹
- **Functional Group/Bond Vibration:** O-H bending (alcohols) or C-H bending (alkenes).
- **Justification:** Peaks near 950 cm⁻¹ can indicate O-H bending vibrations in alcohols or C-H bending in alkenes.
3. **Peak 1099 cm⁻¹ (Strong, Broad)**
- **Wavenumber Assignment:** 1099 cm⁻¹
- **Functional Group/Bond Vibration:** C-O stretching (alcohols, ethers, or esters).
- **Justification:** Strong, broad peaks around 1100 cm⁻¹ are characteristic of C-O stretching vibrations in alcohols, ethers, or esters.
4. **Peak 1635 cm⁻¹ (Weak, Sharp)**
- **Wavenumber Assignment:** 1635 cm⁻¹
- **Functional Group/Bond Vibration:** C=C stretching (alkenes) or C=O stretching (ketones, aldehydes).
- **Justification:** Peaks near 1635 cm⁻¹ are often associated with C=C stretching in alkenes or C=O stretching in carbonyl compounds.
5. **Peak 3336 cm⁻¹ (Weak, Broad)**
- **Wavenumber Assignment:** 3336 cm⁻¹
- **Functional Group/Bond Vibration:** O-H stretching (alcohols or phenols).
- **Justification:** Broad peaks around 3300-3500 cm⁻¹ are characteristic of O-H stretching vibrations in alcohols or phenols.
**Conclusion:**
The FTIR spectrum suggests the presence of an alcohol or phenol (O-H stretching at 3336 cm⁻¹, O-H bending at 953 cm⁻¹, and C-O stretching at 1099 cm⁻¹). The weak peak at 1635 cm⁻¹ may indicate an alkene (C=C) or a carbonyl group (C=O). The peak at 797 cm⁻¹ could suggest an aromatic compound or an alkyl halide. The compound likely belongs to the alcohol or phenol class, potentially with an aromatic or carbonyl substituent.
This discussion presents an infrared spectral analysis combining automated interpretation with reference comparison to support functional group identification and structural assessment.
raw image:
en&2