- 1090 cm⁻¹: C–O stretch (alkoxy or ester) – Weak broad peak suggests alkoxy or ester C–O; typical range 1000–1200 cm⁻¹. - 1154 cm⁻¹: C–O stretch (ester or ether) – Weak broad; consistent with ester or aliphatic ether. - 1450–1457 cm⁻¹: CH₂/CH₃ bending (alkane) – Weak broad; typical for methyl or methylene bending (1450–1470 cm⁻¹). - 1530 cm⁻¹: NO₂ asymmetric stretch (nitro group) – Weak broad; suggests nitro group (1500–1600 cm⁻¹). - 1635 cm⁻¹: C=O stretch (amide or ester) – Weak broad; consistent with amide I or ester C=O (1650–1750 cm⁻¹). - 1743 cm⁻¹: C=O stretch (ester) – Weak sharp; strong indicator of ester (1735–1750 cm⁻¹). - 2862 cm⁻¹: C–H stretch (alkyl) – Weak sharp; aliphatic C–H (2850–2960 cm⁻¹). - 2931 cm⁻¹: C–H stretch (alkyl) – Strong sharp; typical for CH₂/CH₃ (2850–2960 cm⁻¹).
**Conclusion:** The spectrum indicates an ester functional group (1743 cm⁻¹, 1154 cm⁻¹, 1090 cm⁻¹), aliphatic C–H stretches (2862, 2931 cm⁻¹), and a nitro group (1530 cm⁻¹). The presence of both ester and nitro suggests a nitro-ester compound, such as a nitroalkyl ester (e.g., nitroacetate or similar). The broad, weak peaks at 1450–1530 cm⁻¹ and the sharp aliphatic C–H stretches support an aliphatic chain. The compound is likely a nitro-containing ester, such as 2-nitroethyl acetate or similar.
This discussion presents an infrared spectral analysis combining
automated interpretation with reference comparison to support
functional group identification and structural assessment.
FTIR Spectrum Interpretation Summary
Comparative Analysis Conclusion
AI-assisted Interpretation Conclusion
- 1090 cm⁻¹: C–O stretch (alkoxy or ester) – Weak broad peak suggests alkoxy or ester C–O; typical range 1000–1200 cm⁻¹.
- 1154 cm⁻¹: C–O stretch (ester or ether) – Weak broad; consistent with ester or aliphatic ether.
- 1450–1457 cm⁻¹: CH₂/CH₃ bending (alkane) – Weak broad; typical for methyl or methylene bending (1450–1470 cm⁻¹).
- 1530 cm⁻¹: NO₂ asymmetric stretch (nitro group) – Weak broad; suggests nitro group (1500–1600 cm⁻¹).
- 1635 cm⁻¹: C=O stretch (amide or ester) – Weak broad; consistent with amide I or ester C=O (1650–1750 cm⁻¹).
- 1743 cm⁻¹: C=O stretch (ester) – Weak sharp; strong indicator of ester (1735–1750 cm⁻¹).
- 2862 cm⁻¹: C–H stretch (alkyl) – Weak sharp; aliphatic C–H (2850–2960 cm⁻¹).
- 2931 cm⁻¹: C–H stretch (alkyl) – Strong sharp; typical for CH₂/CH₃ (2850–2960 cm⁻¹).
**Conclusion:**
The spectrum indicates an ester functional group (1743 cm⁻¹, 1154 cm⁻¹, 1090 cm⁻¹), aliphatic C–H stretches (2862, 2931 cm⁻¹), and a nitro group (1530 cm⁻¹). The presence of both ester and nitro suggests a nitro-ester compound, such as a nitroalkyl ester (e.g., nitroacetate or similar). The broad, weak peaks at 1450–1530 cm⁻¹ and the sharp aliphatic C–H stretches support an aliphatic chain. The compound is likely a nitro-containing ester, such as 2-nitroethyl acetate or similar.
This discussion presents an infrared spectral analysis combining automated interpretation with reference comparison to support functional group identification and structural assessment.
raw image: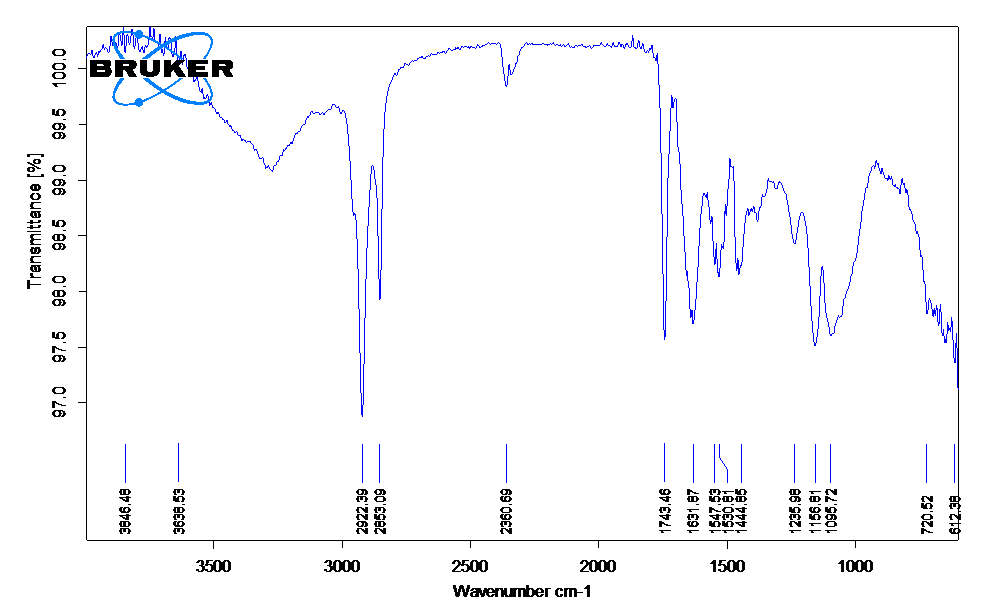 tem.csv
en&2