- **Peak at 1012 cm⁻¹ (strong, sharp):** This strong, sharp absorption in the 1000–1100 cm⁻¹ range is characteristic of a **C–O stretch**, most likely from an **alcohol, ether, or ester**. Its strength and sharpness suggest it is a primary vibrational mode of the molecule, possibly from a **primary or secondary alcohol** or an aliphatic ether.
- **Peak at 1373 cm⁻¹ (weak, sharp):** This weak, sharp peak is typical of a **symmetrical methyl bending vibration (δ CH₃)**. Its weakness indicates methyl groups are not the dominant feature but are present, often seen near 1375 cm⁻¹ in many organic compounds like alkanes or methyl-substituted molecules.
- **Peak at 3284 cm⁻¹ (weak, broad):** A broad absorption in the 3200–3600 cm⁻¹ region is a classic signature of an **O–H stretch**, specifically from a **hydrogen-bonded alcohol or phenol**. The breadth is due to hydrogen bonding, and its relative weakness here may indicate dilution or a less concentrated O–H environment.
**Potential Structure Conclusion:** The spectrum is consistent with an **alcohol-containing compound**, likely a **primary or secondary aliphatic alcohol**. The strong C–O stretch at 1012 cm⁻¹ and the broad O–H stretch at 3284 cm⁻¹ together strongly indicate an alcohol functional group. The weak methyl bend at 1373 cm⁻¹ suggests the presence of methyl groups, possibly in an alkyl chain (e.g., ethanol, propanol, or similar). The absence of strong carbonyl (C=O, ~1700 cm⁻¹) or other prominent peaks narrows the likely identity to a simple alcohol without additional major functional groups.
This discussion presents an infrared spectral analysis combining
automated interpretation with reference comparison to support
functional group identification and structural assessment.
The above shows the FTIR analysis results of a PDF file uploaded by a user from Malaysia. The original image and extracted CSV file are displayed below.tem.csv
FTIR Spectrum Interpretation Summary
Comparative Analysis Conclusion
AI-assisted Interpretation Conclusion
**Analysis of Infrared Absorption Peaks:**
- **Peak at 1012 cm⁻¹ (strong, sharp):** This strong, sharp absorption in the 1000–1100 cm⁻¹ range is characteristic of a **C–O stretch**, most likely from an **alcohol, ether, or ester**. Its strength and sharpness suggest it is a primary vibrational mode of the molecule, possibly from a **primary or secondary alcohol** or an aliphatic ether.
- **Peak at 1373 cm⁻¹ (weak, sharp):** This weak, sharp peak is typical of a **symmetrical methyl bending vibration (δ CH₃)**. Its weakness indicates methyl groups are not the dominant feature but are present, often seen near 1375 cm⁻¹ in many organic compounds like alkanes or methyl-substituted molecules.
- **Peak at 3284 cm⁻¹ (weak, broad):** A broad absorption in the 3200–3600 cm⁻¹ region is a classic signature of an **O–H stretch**, specifically from a **hydrogen-bonded alcohol or phenol**. The breadth is due to hydrogen bonding, and its relative weakness here may indicate dilution or a less concentrated O–H environment.
**Potential Structure Conclusion:**
The spectrum is consistent with an **alcohol-containing compound**, likely a **primary or secondary aliphatic alcohol**. The strong C–O stretch at 1012 cm⁻¹ and the broad O–H stretch at 3284 cm⁻¹ together strongly indicate an alcohol functional group. The weak methyl bend at 1373 cm⁻¹ suggests the presence of methyl groups, possibly in an alkyl chain (e.g., ethanol, propanol, or similar). The absence of strong carbonyl (C=O, ~1700 cm⁻¹) or other prominent peaks narrows the likely identity to a simple alcohol without additional major functional groups.
This discussion presents an infrared spectral analysis combining automated interpretation with reference comparison to support functional group identification and structural assessment.
The above shows the FTIR analysis results of a PDF file uploaded by a user from Malaysia. The original image and extracted CSV file are displayed below.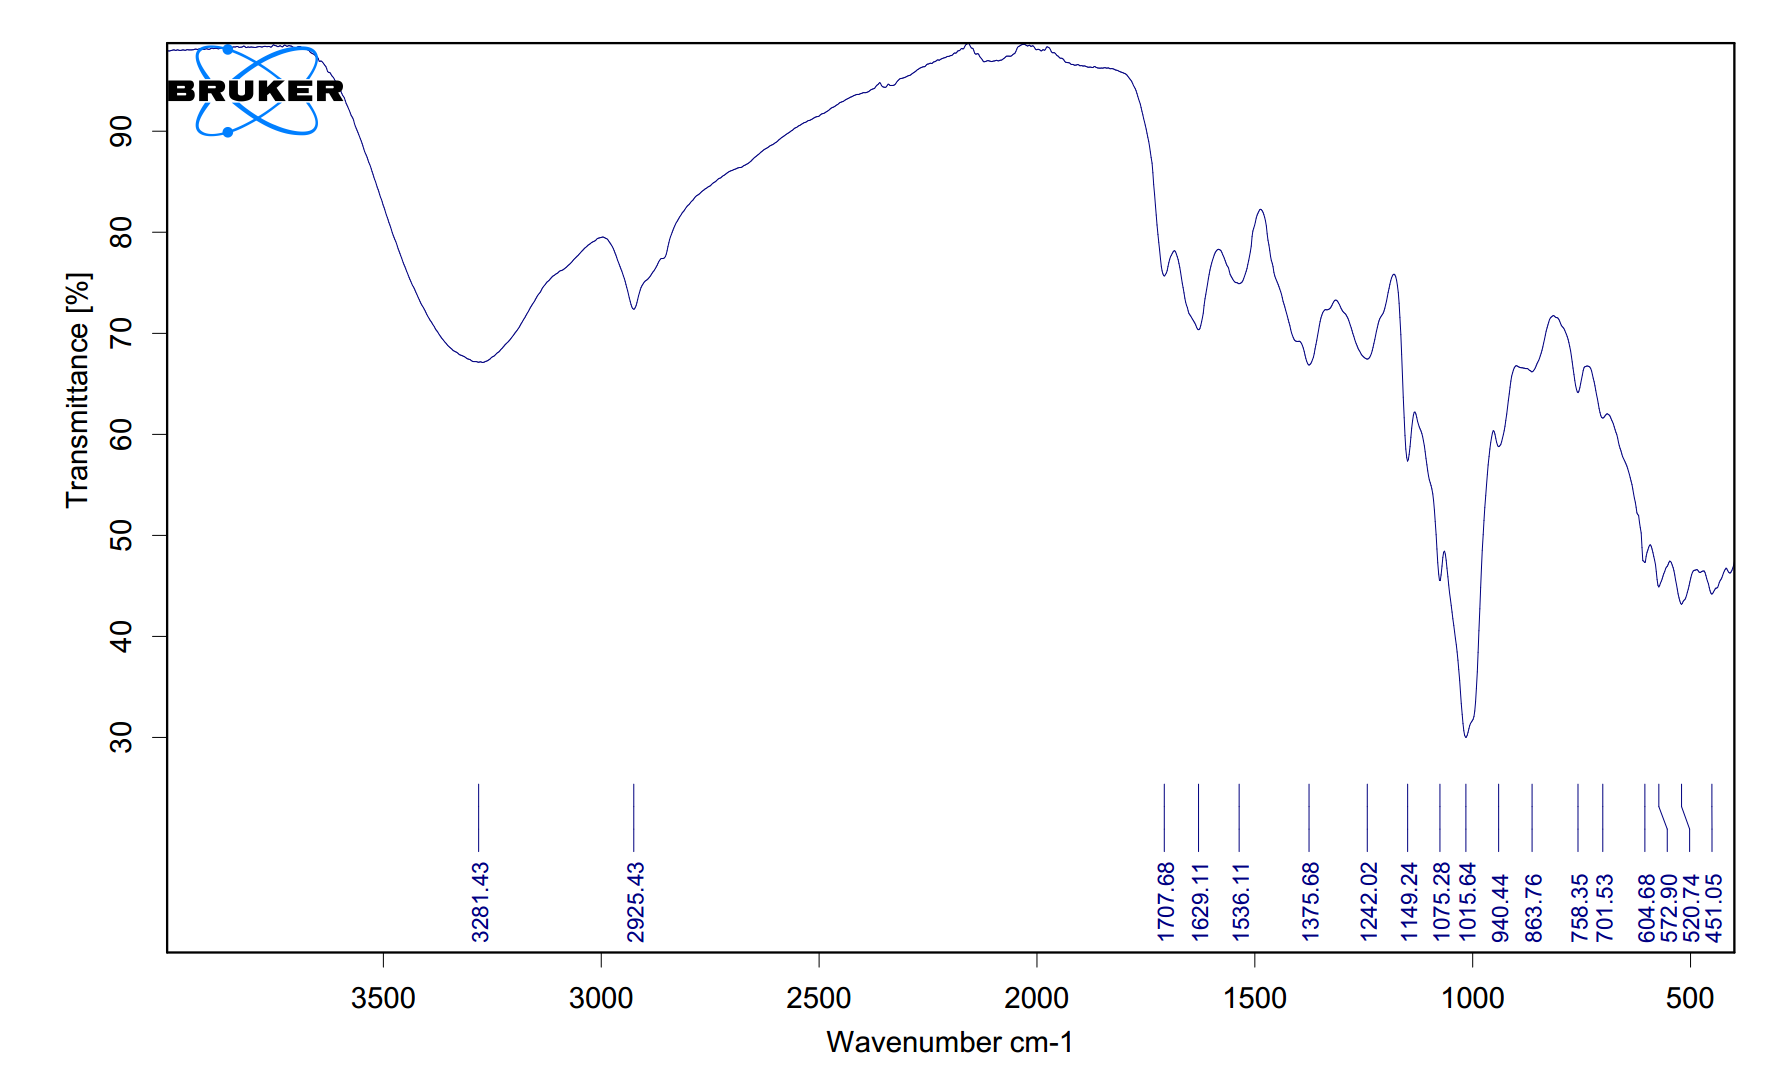 tem.csv
en&2