The infrared peaks suggest an organic compound containing ester and possibly ether functional groups.
- **Peak at 1751 cm⁻¹ (weak, broad):** Characteristic of a carbonyl (C=O) stretch. The relatively low frequency and broadness indicate it is likely an ester carbonyl, not a ketone or aldehyde, which are typically sharper and higher. - **Peaks at 1179 cm⁻¹ & 1038 cm⁻¹ (weak, broad):** These are consistent with C–O stretching vibrations from an ester group. The multiple peaks and broadness are typical for the asymmetric and symmetric stretches in the C–O–C linkage. - **Peak at 1077 cm⁻¹ (strong, sharp):** A very strong, sharp C–O stretch often points to a **cyclic ether** (like an epoxide or tetrahydrofuran derivative) or a primary alcohol, but the absence of a broad O-H stretch (~3300 cm⁻¹) makes an alcohol less likely. This is a dominant structural feature. - **Peak at 1125 cm⁻¹ (weak, sharp):** Likely another C–O stretching mode, possibly from a different chemical environment or an alkyl chain vibration.
**Conclusion:** The sample is most likely an organic molecule containing both an ester group (evidenced by the carbonyl at 1751 cm⁻¹ and supporting C–O stretches) and a cyclic ether moiety (indicated by the intense, sharp peak at 1077 cm⁻¹). The weakness and broadness of the carbonyl peak may suggest conjugation or intramolecular hydrogen bonding, but the compound is not a simple, saturated aliphatic ester due to the prominent ether signature.
This discussion presents an infrared spectral analysis combining
automated interpretation with reference comparison to support
functional group identification and structural assessment.
The above shows the FTIR analysis results of a PDF file uploaded by a user from Malaysia. The original image and extracted CSV file are displayed below.tem.csv
FTIR Spectrum Interpretation Summary
Comparative Analysis Conclusion
AI-assisted Interpretation Conclusion
The infrared peaks suggest an organic compound containing ester and possibly ether functional groups.
- **Peak at 1751 cm⁻¹ (weak, broad):** Characteristic of a carbonyl (C=O) stretch. The relatively low frequency and broadness indicate it is likely an ester carbonyl, not a ketone or aldehyde, which are typically sharper and higher.
- **Peaks at 1179 cm⁻¹ & 1038 cm⁻¹ (weak, broad):** These are consistent with C–O stretching vibrations from an ester group. The multiple peaks and broadness are typical for the asymmetric and symmetric stretches in the C–O–C linkage.
- **Peak at 1077 cm⁻¹ (strong, sharp):** A very strong, sharp C–O stretch often points to a **cyclic ether** (like an epoxide or tetrahydrofuran derivative) or a primary alcohol, but the absence of a broad O-H stretch (~3300 cm⁻¹) makes an alcohol less likely. This is a dominant structural feature.
- **Peak at 1125 cm⁻¹ (weak, sharp):** Likely another C–O stretching mode, possibly from a different chemical environment or an alkyl chain vibration.
**Conclusion:** The sample is most likely an organic molecule containing both an ester group (evidenced by the carbonyl at 1751 cm⁻¹ and supporting C–O stretches) and a cyclic ether moiety (indicated by the intense, sharp peak at 1077 cm⁻¹). The weakness and broadness of the carbonyl peak may suggest conjugation or intramolecular hydrogen bonding, but the compound is not a simple, saturated aliphatic ester due to the prominent ether signature.
This discussion presents an infrared spectral analysis combining automated interpretation with reference comparison to support functional group identification and structural assessment.
The above shows the FTIR analysis results of a PDF file uploaded by a user from Malaysia. The original image and extracted CSV file are displayed below.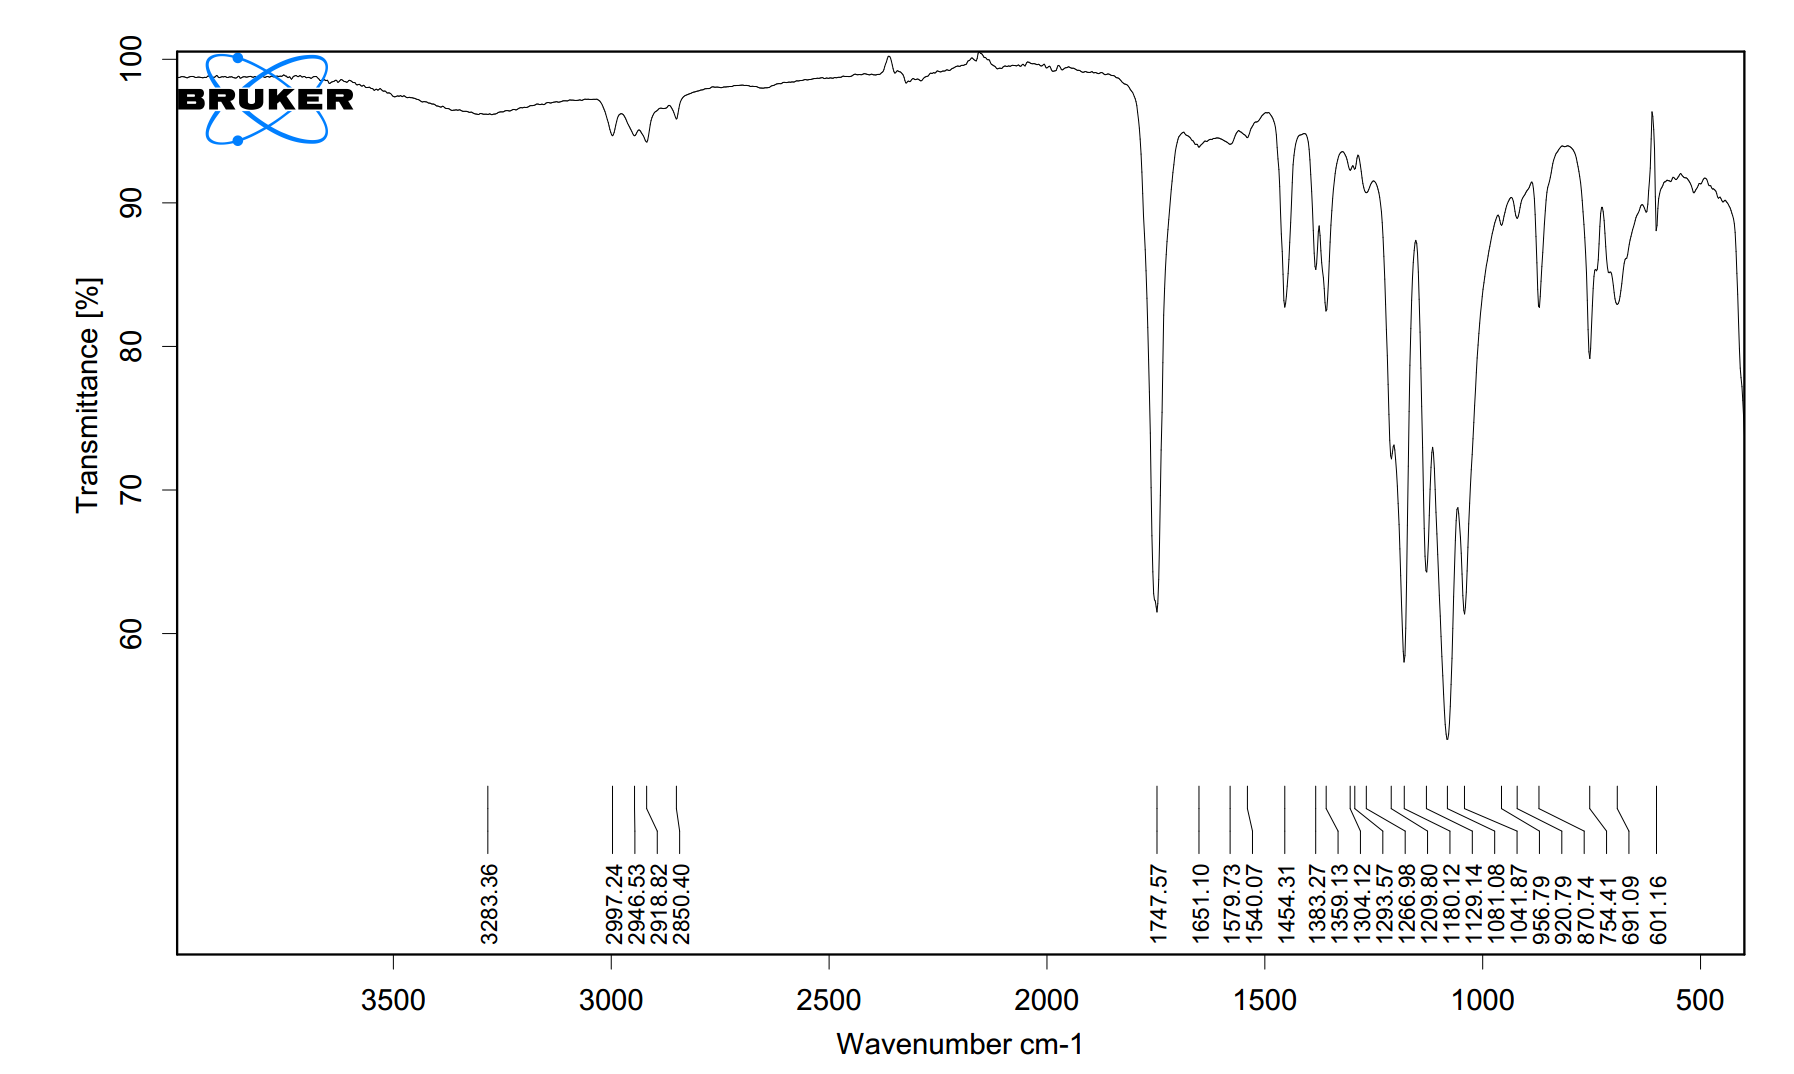 tem.csv
en&2