RESULT PAGE

Oxygen-containing carbonaceous material, likely carbonate or carboxylate

View the report above. Use the comments below if you need follow-up discussion.

Result No.: 20251224193215660547831 Owner: Admin Comments: 1
FTIR ANALYSIS REPORT

FTIR Spectrum Analysis Report

No.: 20251224193215660547831 Date: Reported by: FTIR.fun Contact: [email protected]

Download a professional, formatted PDF of this analysis.

Top15

Similarity-ranked Top-15 library comparison

Library spectrum will appear here.
Library spectrum Interactive sample curve Move the pointer to show the vertical guide line.
Top 15 candidates

Reference library candidates

Rank Match % Compound Name Formula / SMILES Library preview Action
Reference candidates load with this Top-15 workbench.

Based on the library matches and evidence above.

Conclusion

Oxygen-containing carbonaceous material, likely carbonate or carboxylate

Low confidence
Conclusion
  1. Direct literature evidence explicitly attributes the 874 cm⁻¹ peak to carbonate [1] and the 1406 cm⁻¹ peak to carbonate [2].
  2. Related literature reports symmetric carboxylate absorptions for dicarboxylic acids at 1404–1408 cm⁻¹ (Cabaniss et al., 1998), supporting the assignment of the 1406 cm⁻¹ band to carboxylate-containing species.
  3. The 874 cm⁻¹ band agrees with the carbonate ν₂ mode cited by Kasso et al. [1], where it is used as a marker for carbonate content in manuscript fragments.
Evidence & interpretation
Evidence

Key evidence

Library lead candidate
5-Methylpyrimidine #63540
Limitations

Evidence that limits the conclusion

  • The library search identified 5-methylpyrimidine as the top match and points to an aromatic/methoxy composition, but the recorded data (only 874 and 1406 cm⁻¹) lack the characteristic aromatic C–H stretches (~3000–3100 cm⁻¹) and methoxy C–O bands (~1100 cm⁻¹) that would be expected for such a material.
  • The spectrum is limited to two peaks, which restricts full structural elucidation.
  • The exact nature of the carbonate phase (e.g., calcite, aragonite, or amorphous calcium carbonate) and the relative contributions of carbonate versus carboxylate functionalities remain unresolved.
Recommendation

Suggested next verification

  • Acquire a full mid-IR spectrum (4000–400 cm⁻¹) to capture additional functional group bands such as O–H stretches, C=O carbonyls, and C–O single bonds.
  • Use complementary techniques such as X-ray diffraction or Raman spectroscopy to identify the carbonate polymorph and detect any crystalline phases.
  • Compare the fingerprint region with reference spectra of known carbonates and carboxylates for definitive assignment.
Peak analysis

Detected peaks and interpretation

★ = Literature-supported peak assignment.

Need formal wording and manual review? Upgrade to reviewed report
Index Characteristic Wavenumber Absorbance Evidence One-line interpretation Citation Confidence
1 · 1406 1.00 - - - -
2 874 0.16 Literature-supported assignment The band at 874 cm-1 is assigned to carbonate phases. [3] High confidence
Literature

References

Manual Analysis Upgrade

Need a formal reviewed report instead of the standard result page?

The current result page and PDF export are automated outputs. Our Manually Analyzed Formal Report is a separate manual service that can refine wording, check peak assignments and references, and deliver a formal report package for publication drafting, client reporting, or internal QC records.

  • Manual review of peak assignments, references, and conclusion boundaries
  • Formal report wording for sharing with clients, colleagues, or manuscript drafts
  • Optional FTIR.fun electronic seal confirmation on the reviewed report

This reviewed report is an FTIR.fun confirmation document. It does not replace accredited laboratory certification or legal/regulatory conclusions.

Submit Manually Analyzed Formal Report

Your request will be linked to result 20251224193215660547831 so you do not need to explain the result from scratch.

Appendix

Sample information and raw spectrum

Original uploaded spectrum for reference and verification.

Baseline correction method: Asymmetric Least Squares Smoothing

The wavelength range for analysis(cm-1): N/A

Raw spectrum without baseline correction or other processing:

Sample spectrum image
Discussion

Comments and follow-up evidence

Use this area to continue the interpretation, ask questions, or add extra verification evidence.

The above shows the FTIR analysis results of a PNG file uploaded by a user from India. The original image and extracted CSV file are displayed below.20251220180648320137254.png
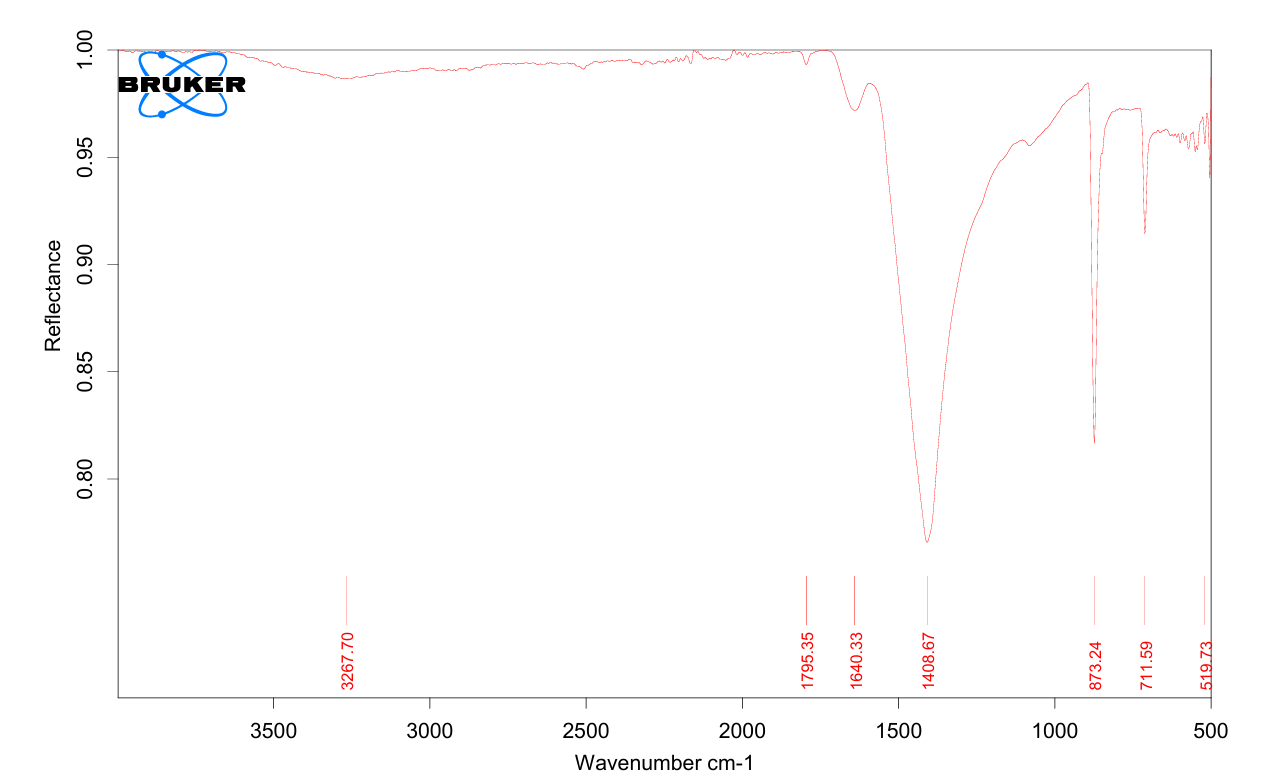
20251220180648320137254.csv

en&2
Submit Request Form