**Analysis:** * **839 cm⁻¹:** This wavenumber falls within the range for C-O-C stretching vibrations (typically 1150-1000 cm⁻¹) or C-Cl stretching (850-550 cm⁻¹). Given the broadness and the presence of a strong, broad peak at 1092 cm⁻¹, assignment to a C-O-C vibration is more plausible, possibly from an ether or alcohol. * **1092 cm⁻¹:** This is a strong, broad peak characteristic of C-O stretching vibrations, commonly observed in primary and secondary alcohols, ethers, or esters. The breadth often indicates hydrogen bonding, frequently associated with alcohols or carboxylic acids. * **1193 cm⁻¹:** This sharp peak is consistent with C-O stretching, potentially from an ester or a tertiary alcohol, or C-F stretching (1350-1000 cm⁻¹). The sharpness suggests a less hindered or non-hydrogen-bonded environment. * **2829 cm⁻¹ & 2929 cm⁻¹:** These peaks are in the C-H stretching region. The 2929 cm⁻¹ peak (medium, broad) is typical for asymmetric C-H stretching in aliphatic CH₂ groups. The 2829 cm⁻¹ peak (weak, sharp) is unusually low for standard aliphatic C-H stretches (typically >2850 cm⁻¹) but can correspond to aldehyde C-H stretching (~2720-2820 cm⁻¹) or possibly O-CH₃ stretching (near 2820-2830 cm⁻¹).
**Conclusion / Inference:** * **Supported Functional Groups:** The spectrum strongly indicates the presence of **C-O bonds** (alcohols, ethers, or esters) and **aliphatic C-H bonds** (CH₂ groups). * **Inference [Based on Pattern]:** * The combination of a strong, broad C-O stretch (~1092 cm⁻¹) and aliphatic C-H stretches suggests an **alcohol-containing compound**, likely a primary or secondary alcohol with hydrogen bonding. * The sharp peak at 1193 cm⁻¹ could indicate a distinct, non-hydrogen-bonded C-O environment or a C-F bond, but data is insufficient to confirm the latter. * The peak at 2829 cm⁻¹ is atypical. **[Speculation]** It could be a weak aldehyde C-H stretch, but the absence of a corresponding strong carbonyl stretch (C=O, ~1700 cm⁻¹) makes this unlikely. A more plausible speculation is the presence of a **methoxy group (O-CH₃)**, where the symmetric C-H stretch can appear near 2820-2830 cm⁻¹, consistent with the 2929 cm⁻¹ peak as the asymmetric stretch. * **Primary Chemical Components (Inferred):** The sample likely contains **aliphatic chains (CH₂)** and **ether/alcohol functional groups**. A compound with a **methoxy terminus (CH₃-O-)** and a longer aliphatic chain with hydroxyl groups is a plausible candidate based on the peak pattern. The initial system suggestion of a poly(ethylene glycol) derivative aligns with this inferred pattern (C-O-C, C-O, CH₂), but specific identification requires additional data.
This discussion presents an infrared spectral analysis combining
automated interpretation with reference comparison to support
functional group identification and structural assessment.
FTIR Spectrum Interpretation Summary
Comparative Analysis Conclusion
AI-assisted Interpretation Conclusion
**Data:**
* 839 cm⁻¹: medium, broad
* 1092 cm⁻¹: strong, broad
* 1193 cm⁻¹: medium, sharp
* 2829 cm⁻¹: weak, sharp
* 2929 cm⁻¹: medium, broad
**Analysis:**
* **839 cm⁻¹:** This wavenumber falls within the range for C-O-C stretching vibrations (typically 1150-1000 cm⁻¹) or C-Cl stretching (850-550 cm⁻¹). Given the broadness and the presence of a strong, broad peak at 1092 cm⁻¹, assignment to a C-O-C vibration is more plausible, possibly from an ether or alcohol.
* **1092 cm⁻¹:** This is a strong, broad peak characteristic of C-O stretching vibrations, commonly observed in primary and secondary alcohols, ethers, or esters. The breadth often indicates hydrogen bonding, frequently associated with alcohols or carboxylic acids.
* **1193 cm⁻¹:** This sharp peak is consistent with C-O stretching, potentially from an ester or a tertiary alcohol, or C-F stretching (1350-1000 cm⁻¹). The sharpness suggests a less hindered or non-hydrogen-bonded environment.
* **2829 cm⁻¹ & 2929 cm⁻¹:** These peaks are in the C-H stretching region. The 2929 cm⁻¹ peak (medium, broad) is typical for asymmetric C-H stretching in aliphatic CH₂ groups. The 2829 cm⁻¹ peak (weak, sharp) is unusually low for standard aliphatic C-H stretches (typically >2850 cm⁻¹) but can correspond to aldehyde C-H stretching (~2720-2820 cm⁻¹) or possibly O-CH₃ stretching (near 2820-2830 cm⁻¹).
**Conclusion / Inference:**
* **Supported Functional Groups:** The spectrum strongly indicates the presence of **C-O bonds** (alcohols, ethers, or esters) and **aliphatic C-H bonds** (CH₂ groups).
* **Inference [Based on Pattern]:**
* The combination of a strong, broad C-O stretch (~1092 cm⁻¹) and aliphatic C-H stretches suggests an **alcohol-containing compound**, likely a primary or secondary alcohol with hydrogen bonding.
* The sharp peak at 1193 cm⁻¹ could indicate a distinct, non-hydrogen-bonded C-O environment or a C-F bond, but data is insufficient to confirm the latter.
* The peak at 2829 cm⁻¹ is atypical. **[Speculation]** It could be a weak aldehyde C-H stretch, but the absence of a corresponding strong carbonyl stretch (C=O, ~1700 cm⁻¹) makes this unlikely. A more plausible speculation is the presence of a **methoxy group (O-CH₃)**, where the symmetric C-H stretch can appear near 2820-2830 cm⁻¹, consistent with the 2929 cm⁻¹ peak as the asymmetric stretch.
* **Primary Chemical Components (Inferred):** The sample likely contains **aliphatic chains (CH₂)** and **ether/alcohol functional groups**. A compound with a **methoxy terminus (CH₃-O-)** and a longer aliphatic chain with hydroxyl groups is a plausible candidate based on the peak pattern. The initial system suggestion of a poly(ethylene glycol) derivative aligns with this inferred pattern (C-O-C, C-O, CH₂), but specific identification requires additional data.
This discussion presents an infrared spectral analysis combining automated interpretation with reference comparison to support functional group identification and structural assessment.
raw image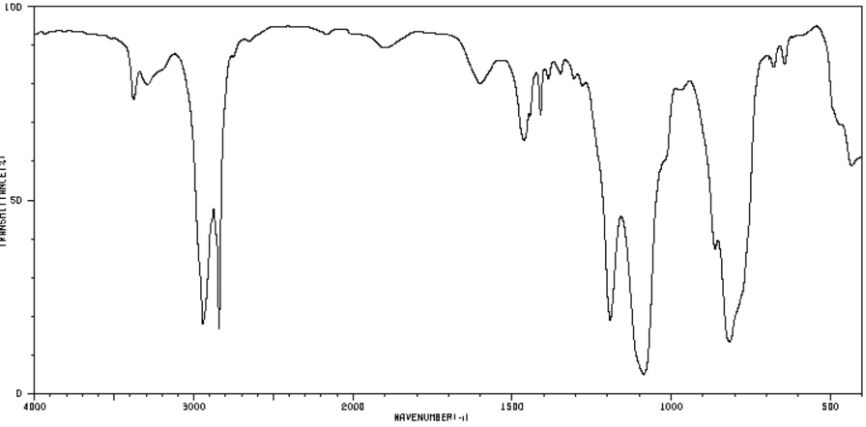
en&2