Peak 1037 cm⁻¹: Strong sharp absorption, assigned to C-O stretching vibration in ethers or alcohols. Peak 1049 cm⁻¹: Strong sharp absorption, indicative of C-O stretching or C-C skeletal vibrations in aliphatic chains. Peak 1602 cm⁻¹: Weak sharp absorption, attributed to C=C stretching in aromatic rings or alkenes. Peak 3286 cm⁻¹: Weak broad absorption, characteristic of O-H stretching in alcohols or phenols, potentially with hydrogen bonding.
Conclusion: The sample likely contains ether/alcohol C-O groups, possible aromatic/alkene C=C bonds, and weak O-H functionality. The primary chemical components may include aliphatic ethers, alcohols, or aromatic derivatives with minor hydroxyl content. Current data insufficient to determine exact molecular structure.
This discussion presents an infrared spectral analysis combining
automated interpretation with reference comparison to support
functional group identification and structural assessment.
FTIR Spectrum Interpretation Summary
Comparative Analysis Conclusion
AI-assisted Interpretation Conclusion
Peak 1037 cm⁻¹: Strong sharp absorption, assigned to C-O stretching vibration in ethers or alcohols.
Peak 1049 cm⁻¹: Strong sharp absorption, indicative of C-O stretching or C-C skeletal vibrations in aliphatic chains.
Peak 1602 cm⁻¹: Weak sharp absorption, attributed to C=C stretching in aromatic rings or alkenes.
Peak 3286 cm⁻¹: Weak broad absorption, characteristic of O-H stretching in alcohols or phenols, potentially with hydrogen bonding.
Conclusion: The sample likely contains ether/alcohol C-O groups, possible aromatic/alkene C=C bonds, and weak O-H functionality. The primary chemical components may include aliphatic ethers, alcohols, or aromatic derivatives with minor hydroxyl content.
Current data insufficient to determine exact molecular structure.
This discussion presents an infrared spectral analysis combining automated interpretation with reference comparison to support functional group identification and structural assessment.
RAW IMAGE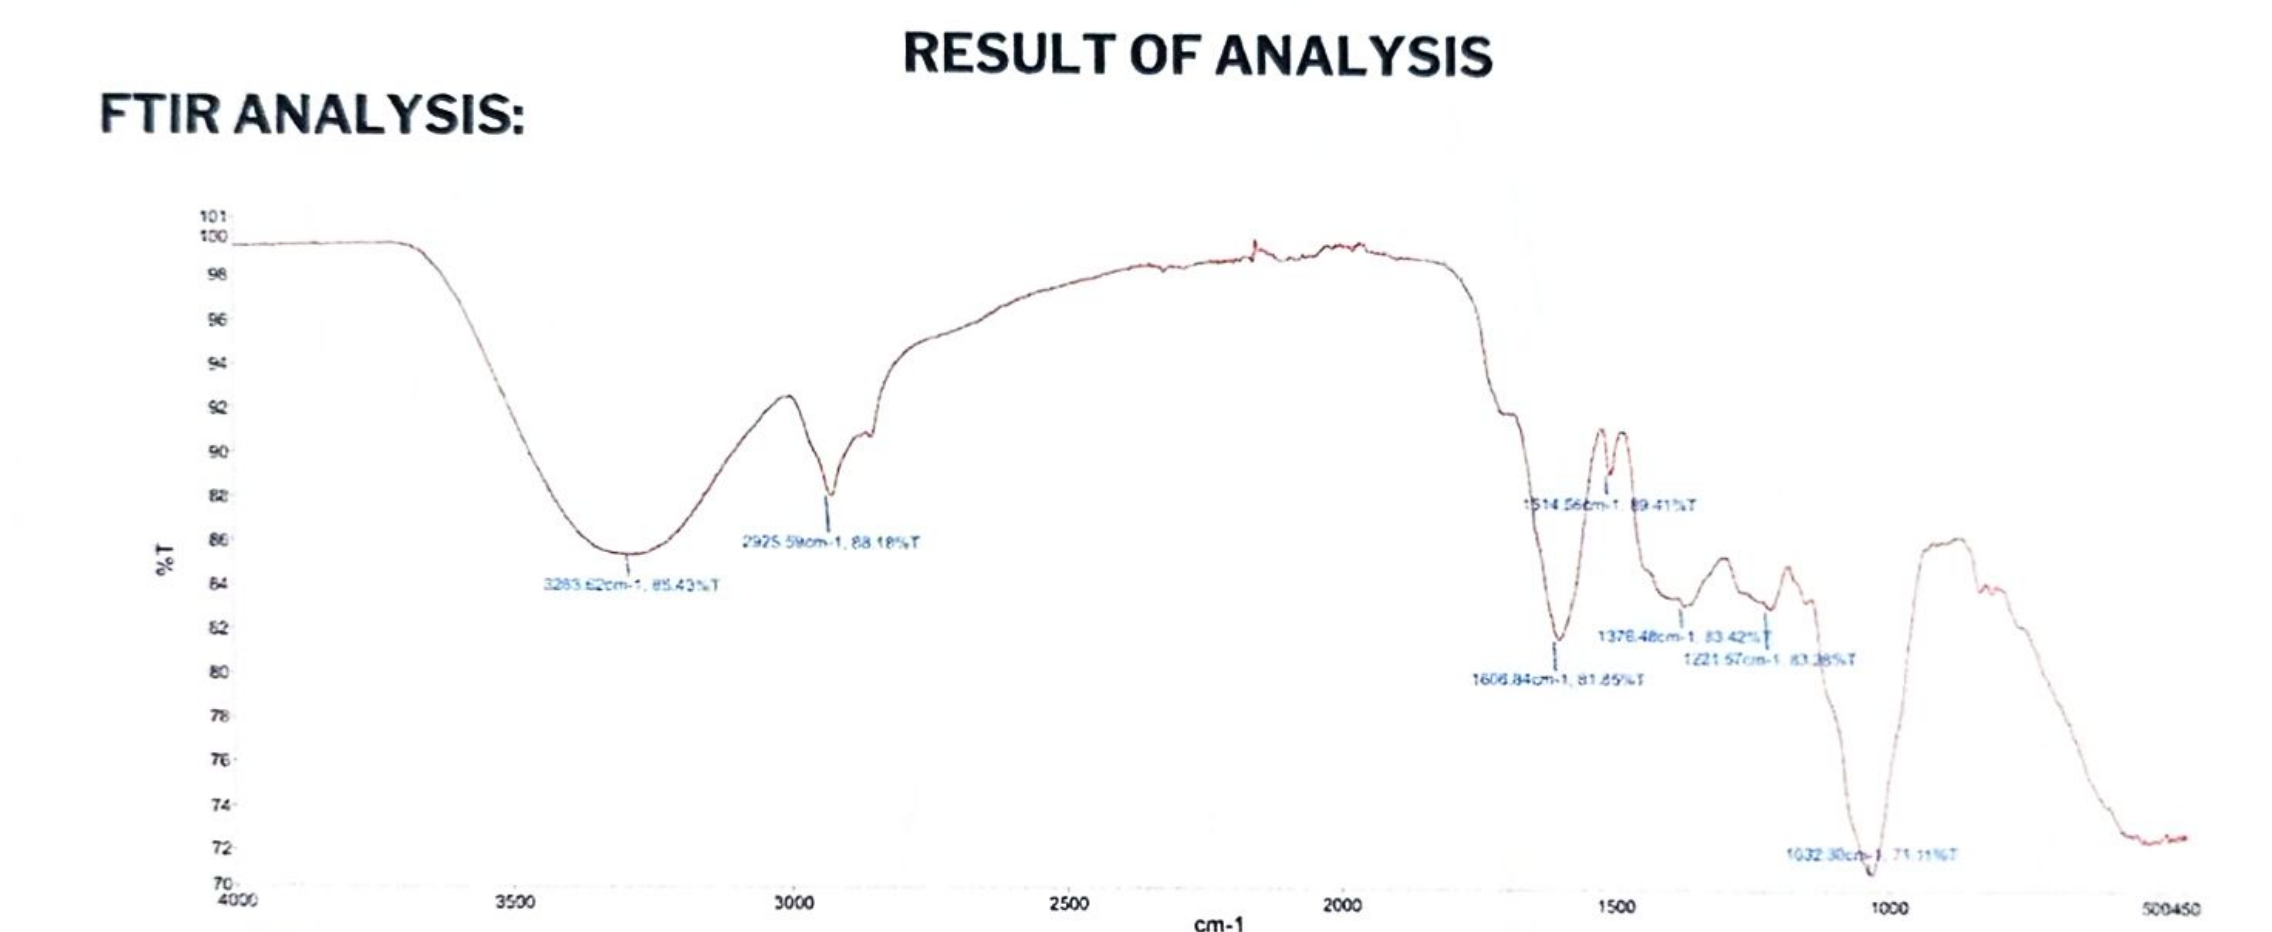 tem.csv
en&2